Remove Analytics Remove Data Visualization Remove White paper
article thumbnail

Enterprise fraud management, AI and data visualization

Cambridge Intelligence

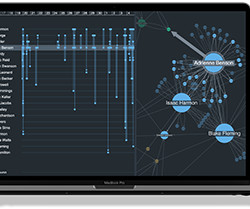
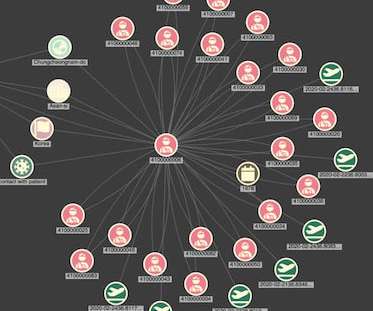
FREE: Graph visualization and artificial intelligence white paper Find out how successful businesses work with the latest graph visualization and AI technologies to make fast, business-critical decisions. When we visualize the entire dataset, we get a clearer idea of its overall shape.

article thumbnail

A product manager’s guide to data visualization options

Cambridge Intelligence

We’ve blogged before about the benefits of graph visualization SDKs over open source graph libraries. There are other data visualization options available too, such as off-the-shelf apps and popular diagramming tools. 40,000 nodes and links visualized using KeyLines Does it tick the right boxes for your C-suite executives?

professionals

Sign Up for our Newsletter

This site is protected by reCAPTCHA and the Google Privacy Policy and Terms of Service apply.

article thumbnail

How Big Data Leads To Improvements In Company Letterhead Designs

Smart Data Collective

Big data has been at the forefront of the design industry for years. A number of companies have written detailed articles on the utilization of data visualization with graphics. However, big data can be effective in more rudimentary designs as well. There are a lot of effective ways to use big data to make better designs.

Big Data 101
article thumbnail

Why cyber threats are a business problem, not just a tech problem

Cambridge Intelligence

Splunk’s number one recommendation is “to use data and analytics to optimize threat detection and response”. They found that respondents were using analytics across their entire attack lifecycle to “improve threat detection (37%), help identify cyber risks (36%) and accelerate investigations (33%)”.

article thumbnail

5 Early Indicators Your Embedded Analytics Will Fail

Many application teams leave embedded analytics to languish until something—an unhappy customer, plummeting revenue, a spike in customer churn—demands change. In this White Paper, Logi Analytics has identified 5 tell-tale signs your project is moving from “nice to have” to “needed yesterday.".

article thumbnail

Graph visualization use cases

Cambridge Intelligence

The challenge to understand hidden relationships and uncover actionable insights from data is universal, across countless data visualization use cases. In this blog post, we focus on seven of the most popular: Why visualize data as a graph? Data visualization makes it easy for us to identify trends and outliers.

article thumbnail

TigerGraph tutorial: how to integrate with ReGraph

Cambridge Intelligence

Using one of TigerGraph’s sample datasets – featuring anonymized COVID-19 patient data – I’ll demonstrate how you can use our flexible ReGraph toolkit to visualize your TigerGraph data and find answers to complex queries fast. Now we’ll create a database query that we can use in ReGraph.

article thumbnail

Monetizing Analytics Features

Think your customers will pay more for data visualizations in your application? But today, dashboards and visualizations have become table stakes. Turning analytics into a source of revenue means integrating advanced features in unique, hard-to-steal ways. Five years ago, they may have.