article thumbnail

OUT NOW: Cloud security visualization white paper

Cambridge Intelligence

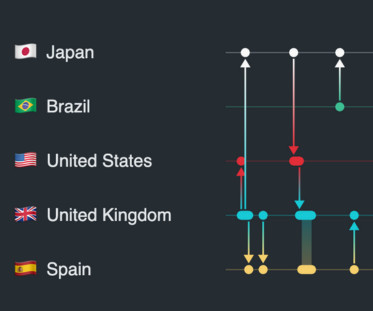
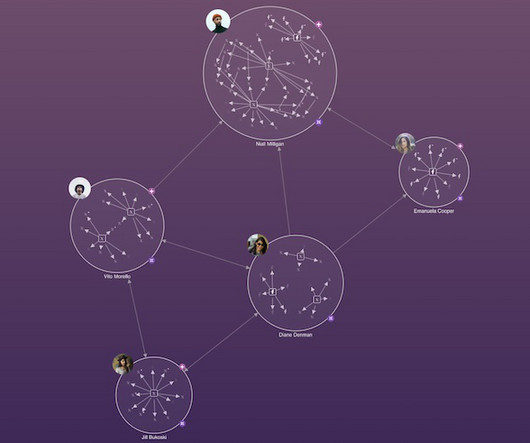
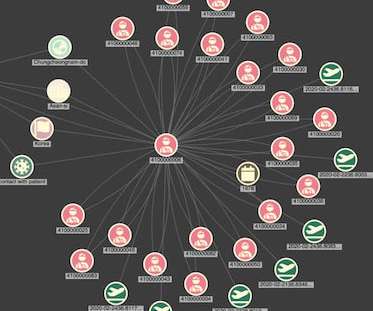
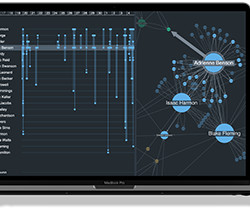
Timeline analysis, together with network visualization, are powerful ways to understand cloud activity I’ve written a cloud security visualization white paper for anyone in the cybersecurity industry who needs to understand the challenge of keeping cloud assets secure. Why visualize cloud security?

article thumbnail

AI and data visualization: Powering the intelligence cycle

Cambridge Intelligence

Artificial intelligence is changing the way organizations think about data analysis. AI and data visualization can do a lot of the heavy lifting for analysts and investigators working with connected data – helping them detect, understand and even predict risks and threats.

professionals

Sign Up for our Newsletter

This site is protected by reCAPTCHA and the Google Privacy Policy and Terms of Service apply.

article thumbnail

A product manager’s guide to data visualization options

Cambridge Intelligence

We’ve blogged before about the benefits of graph visualization SDKs over open source graph libraries. There are other data visualization options available too, such as off-the-shelf apps and popular diagramming tools. 40,000 nodes and links visualized using KeyLines Does it tick the right boxes for your C-suite executives?

article thumbnail

Product update: enhance your timeline with emojis and ping animation

Cambridge Intelligence

FREE: KronoGraph white paper Our essential guide to building powerful timeline visualization applications GET YOUR FREE GUIDE Discover the power of emojis We’re always working to make our data visualization toolkits as flexible as possible, with infinite styling and customization options.

article thumbnail

5 Early Indicators Your Embedded Analytics Will Fail

In this White Paper, Logi Analytics has identified 5 tell-tale signs your project is moving from “nice to have” to “needed yesterday.". Many application teams leave embedded analytics to languish until something—an unhappy customer, plummeting revenue, a spike in customer churn—demands change. But by then, it may be too late.

article thumbnail

Eight financial services trends driving the need for better data visualization

Cambridge Intelligence

We’ve recently explored the huge impact of AI in fraud detection – in this post, we’ll look at eight other trends driving demand for better data visualization in the financial services sector. To stay ahead, you need to understand data, quickly. FREE: Start your trial today Visualize your data!

article thumbnail

Enterprise fraud management, AI and data visualization

Cambridge Intelligence

FREE: Graph visualization and artificial intelligence white paper Find out how successful businesses work with the latest graph visualization and AI technologies to make fast, business-critical decisions. The post Enterprise fraud management, AI and data visualization appeared first on Cambridge Intelligence.

article thumbnail

Monetizing Analytics Features

Think your customers will pay more for data visualizations in your application? But today, dashboards and visualizations have become table stakes. Download this white paper to discover which features will differentiate your application and maximize the ROI of your analytics. Five years ago, they may have.