Remove 2013 Remove Analytics Remove Data Visualization
article thumbnail

Tableau: 9 years a Leader in Gartner Magic Quadrant for Analytics and Business Intelligence Platforms

Tableau

This week, Gartner published the 2021 Magic Quadrant for Analytics and Business Intelligence Platforms. I first want to thank you, the Tableau Community, for your continued support and your commitment to data, to Tableau, and to each other. Accelerate adoption with intuitive analytics that people love to use. Francois Ajenstat.

Tableau 102
article thumbnail

How Big Data Impacts The Finance And Banking Industries

Smart Data Collective

Nowadays, terms like ‘Data Analytics,’ ‘Data Visualization,’ and ‘Big Data’ have become quite popular. In this modern age, each business entity is driven by data. Data analytics are now very crucial whenever there is a decision-making process involved. Perks Associated with Big Data.

Big Data 145
professionals

Sign Up for our Newsletter

This site is protected by reCAPTCHA and the Google Privacy Policy and Terms of Service apply.

article thumbnail

Best of Tableau Web: July 2022

Tableau

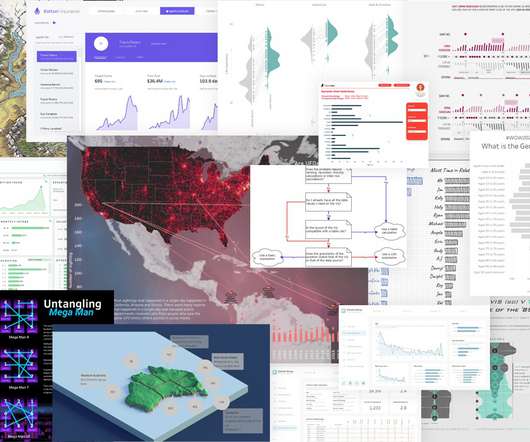
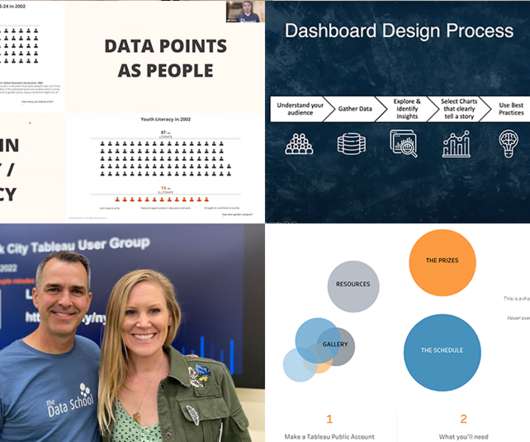
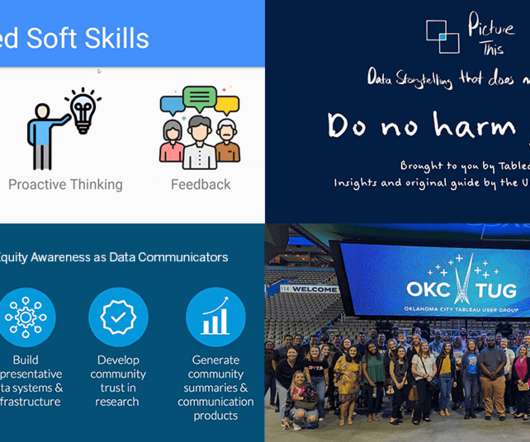
Similar to the advancements in telescope technology, data visualizations 10 years ago were no where near the art they’ve become today. Vizzes advance as the industry learns more about accessibility and human cognition, and as improved data literacy pushes the world to be more data driven. Go TEAM DATA!

Tableau 105
article thumbnail

Best of Tableau Web: July 2022

Tableau

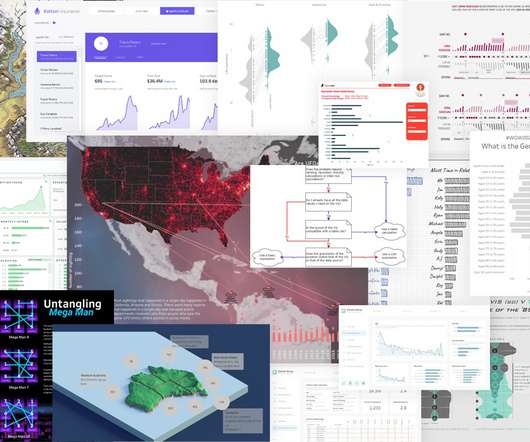
Similar to the advancements in telescope technology, data visualizations 10 years ago were no where near the art they’ve become today. Vizzes advance as the industry learns more about accessibility and human cognition, and as improved data literacy pushes the world to be more data driven. Go TEAM DATA!

Tableau 98
article thumbnail

New Study: 2018 State of Embedded Analytics Report

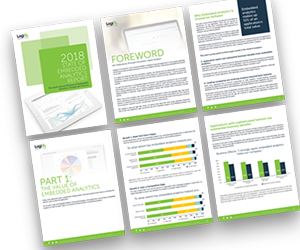
Why do some embedded analytics projects succeed while others fail? We surveyed 500+ application teams embedding analytics to find out which analytics features actually move the needle. Read the 6th annual State of Embedded Analytics Report to discover new best practices. Brought to you by Logi Analytics.

article thumbnail

Analyzing the history of Tableau innovation

Tableau

In this blog post, I'll describe my analysis of Tableau's history to drive analytics innovation—in particular, I've identified six key innovation vectors through reflecting on the top innovations across Tableau releases. And with this work, I invite discussions about this history, my analysis, and the implications for the future of analytics.

Tableau 145
article thumbnail

Tableau: 9 years a Leader in Gartner Magic Quadrant for Analytics and Business Intelligence Platforms

Tableau

This week, Gartner published the 2021 Magic Quadrant for Analytics and Business Intelligence Platforms. I first want to thank you, the Tableau Community, for your continued support and your commitment to data, to Tableau, and to each other. Accelerate adoption with intuitive analytics that people love to use. Francois Ajenstat.

Tableau 52
article thumbnail

Monetizing Analytics Features: Why Data Visualizations Will Never Be Enough

Think your customers will pay more for data visualizations in your application? But today, dashboards and visualizations have become table stakes. Discover which features will differentiate your application and maximize the ROI of your embedded analytics. Brought to you by Logi Analytics.