This site uses cookies to improve your experience. To help us insure we adhere to various privacy regulations, please select your country/region of residence. If you do not select a country, we will assume you are from the United States. Select your Cookie Settings or view our Privacy Policy and Terms of Use.
Cookie Settings
Cookies and similar technologies are used on this website for proper function of the website, for tracking performance analytics and for marketing purposes. We and some of our third-party providers may use cookie data for various purposes. Please review the cookie settings below and choose your preference.
Used for the proper function of the website
Used for monitoring website traffic and interactions
Cookie Settings
Cookies and similar technologies are used on this website for proper function of the website, for tracking performance analytics and for marketing purposes. We and some of our third-party providers may use cookie data for various purposes. Please review the cookie settings below and choose your preference.
Strictly Necessary: Used for the proper function of the website
Performance/Analytics: Used for monitoring website traffic and interactions
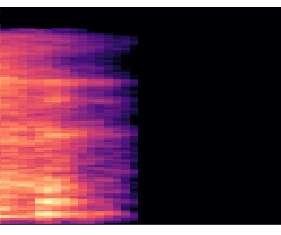
ArticleVideo Book This article was published as a part of the Data Science Blogathon COVID-19 COVID-19 (coronavirus disease 2019) is a disease that causes respiratory. The post How to Detect COVID-19 Cough From Mel Spectrogram Using Convolutional Neural Network appeared first on Analytics Vidhya.
Big data is one of the most rapidly growing industries in the world and was valued at $169 billion in 2018, with expectations to approach the $300 billion mark by the end of next year. Even with such monetary influence in the world already, the industry is still figuring itself.
Introduction to Modern Statistics by Mine Cetinkaya-Rundel and Johanna Hardin is a free-to-download book: Introduction to Modern Statistics is a re-imagining of a previous title, Introduction to Statistics with Randomization and Simulation book. The new book puts a heavy emphasis on exploratory data analysis (specifically exploring multivariate relationships using visualization, summarization, and descriptive models) and provides a thorough discussion of simulation-based inference using randomiz
Blockchain has played a very important role in the inception of bitcoin and other cryptocurrencies. Blockchain even transformed the traditional financial industry, as around 15% of banks started using it in 2017. Blockchain has also created an unexpected bridge between the cryptocurrency market and traditional financial providers. It has made it possible to start accessing bitcoins the same way people would access regular fiat currencies.
Apache Airflow® 3.0, the most anticipated Airflow release yet, officially launched this April. As the de facto standard for data orchestration, Airflow is trusted by over 77,000 organizations to power everything from advanced analytics to production AI and MLOps. With the 3.0 release, the top-requested features from the community were delivered, including a revamped UI for easier navigation, stronger security, and greater flexibility to run tasks anywhere at any time.
ArticleVideo Book This article was published as a part of the Data Science Blogathon Introduction Plotting is essentially one of the most important steps in. The post Plotting Visualizations Out of Pandas DataFrames appeared first on Analytics Vidhya.
This article was originally published on Grit Daily and is reproduced with permission. One of the more commonly used AI developments is computer vision. Whether it is Google Lens or Pinterest Lens, it is easy to get users to adopt. After all, 1,074 photos are uploaded on Instagram every second.
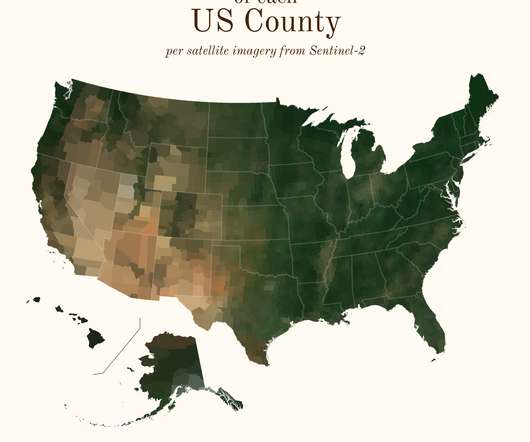
Based on satellite imagery, Erin Davis found the average color of places around the world. The above is by county in the United States, but Davis also made maps by country, which are a mix of greens, browns, and yellows. See also the NYT piece from 2020 , which framed color by political leaning. Tags: color , Erin Davis , R , satellite imagery.
126
126
Sign up to get articles personalized to your interests!
Data Science Current brings together the best content for data science professionals from the widest variety of thought leaders.
Based on satellite imagery, Erin Davis found the average color of places around the world. The above is by county in the United States, but Davis also made maps by country, which are a mix of greens, browns, and yellows. See also the NYT piece from 2020 , which framed color by political leaning. Tags: color , Erin Davis , R , satellite imagery.
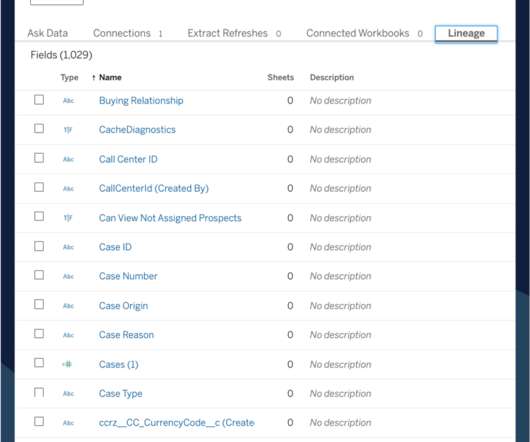
Santiago Becerra. Senior Director of Engineering, Augmented Analytics. Spencer Czapiewski. July 1, 2021 - 10:57pm. July 6, 2021. Since the original launch of Ask Data, our natural language interface, customers have signaled an increased appetite to introduce Ask Data more broadly across their organization. With the Tableau 2021.2 release, we’re excited to help our customers bring augmented analytics to more people—now, a reimagined Ask Data experience is available to all licensed Tableau users.
ArticleVideo Book This article was published as a part of the Data Science Blogathon How amazing it is to talk to someone by asking and. The post Build a simple Chatbot using NLTK Library in Python appeared first on Analytics Vidhya.
It’s time to announce our first speakers at Data Natives x VentureBeat Transform, the week-long AI conference where we’ll be hosting half a day of amazing, educational content. VentureBeat Transform 2021 takes place between July 12-16, 2021. The event is hosted online and includes a stellar cast of speakers and.
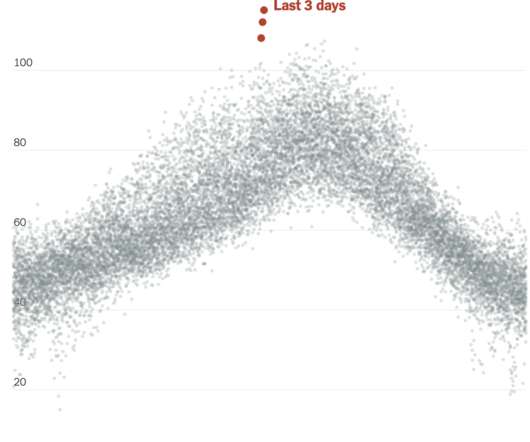
It’s been hot in the Pacific Northwest the past few days. NYT’s The Upshot plotted the temperatures against previous max temperatures since 1979. Hot. Tags: climate change , temperature , Upshot.
Speaker: Alex Salazar, CEO & Co-Founder @ Arcade | Nate Barbettini, Founding Engineer @ Arcade | Tony Karrer, Founder & CTO @ Aggregage
There’s a lot of noise surrounding the ability of AI agents to connect to your tools, systems and data. But building an AI application into a reliable, secure workflow agent isn’t as simple as plugging in an API. As an engineering leader, it can be challenging to make sense of this evolving landscape, but agent tooling provides such high value that it’s critical we figure out how to move forward.
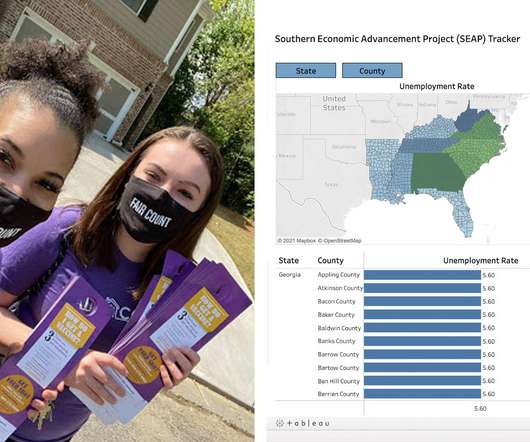
Neal Myrick. Global Head of the Tableau Foundation. Kristin Adderson. July 1, 2021 - 1:48am. July 6, 2021. One year ago, Tableau Foundation launched our Racial Justice Data Initiative out of a core belief that data can and should play a transformative role in the fight for racial equity and justice in the United States. We have forged new partnerships and deepened existing relationships with organizations committed to using data to raise awareness of inequities, point to solutions, and advocate
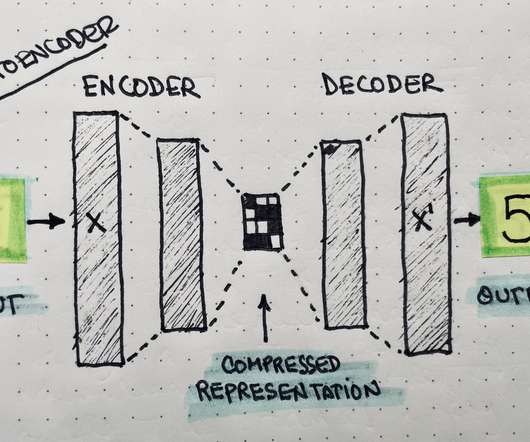
ArticleVideo Book This article was published as a part of the Data Science Blogathon Introduction An autoencoder is actually an Artificial Neural Network that is. The post Complete guide on How to use Autoencoders in Python appeared first on Analytics Vidhya.
Artificial intelligence is very important for solving many modern business challenges. One of the most important applications of AI technology is in the context of cybersecurity. Ransomware is a significant threat in our connected world. Whether it’s at your business or on your personal devices, a hacker/attacker can cause untold damage and wreak havoc on your life with a successful ransomware attack.
NPR put together a set of stories, videos, and interactives about bringing more joy into your life , which of course is always welcome. Tags: joy , NPR.
Speaker: Andrew Skoog, Founder of MachinistX & President of Hexis Representatives
Manufacturing is evolving, and the right technology can empower—not replace—your workforce. Smart automation and AI-driven software are revolutionizing decision-making, optimizing processes, and improving efficiency. But how do you implement these tools with confidence and ensure they complement human expertise rather than override it? Join industry expert Andrew Skoog as he explores how manufacturers can leverage automation to enhance operations, streamline workflows, and make smarter, data-dri
ArticleVideo Book This article was published as a part of the Data Science Blogathon Introduction “Vision is an Art of Seeing what is invisible to. The post An Ultimate Guide to Opencv-Learning Libraries 1.0 appeared first on Analytics Vidhya.
Click to learn more about author Matt Tanner. Knowledge graphs aren’t new, but they’re the latest and greatest trend as people and companies realize just how versatile they are. Whether your e-commerce business needs to offer your customers better product recommendations and targeted coupons or your payment processor needs to provide fraud detection on a massive, […].
FlowingData turned 14 years old last week. Is that old? It feels old. The site started as a sandbox to put class projects. Flat HTML files. JPEG files. Google Maps placemarkers. Flash. Vanilla JavaScript. As I studied from across the country, it turned into a place to share links with classmates. Did you see that project on Infosthetics? How did Stamen make that map?
Documents are the backbone of enterprise operations, but they are also a common source of inefficiency. From buried insights to manual handoffs, document-based workflows can quietly stall decision-making and drain resources. For large, complex organizations, legacy systems and siloed processes create friction that AI is uniquely positioned to resolve.
E-commerce companies around the world are investing more in data centers than ever before. The benefits of data centers for e-commerce companies are undeniable. They give online retailers high levels of control over their own internal data. They are not subject to data loss from hosting it in the cloud, which might have retention policies outside their control.
ArticleVideo Book This article was published as a part of the Data Science Blogathon “What’s behind driverless cars? Artificial Intelligence or more specifically Deep Learning” . The post Top 5 Skills Needed to be a Deep Learning Engineer! appeared first on Analytics Vidhya.
Meghan Cooney. RVP Analytics & AI, Insurance, Tableau. Kristin Adderson. June 28, 2021 - 6:08pm. June 28, 2021. The insurance industry has always been driven by data. Without it, measuring and managing risk would be an impractical and ineffective business model. As technology continues to advance, especially in a hyper-digitized, post-pandemic world, more and more data is available about insurance customers.
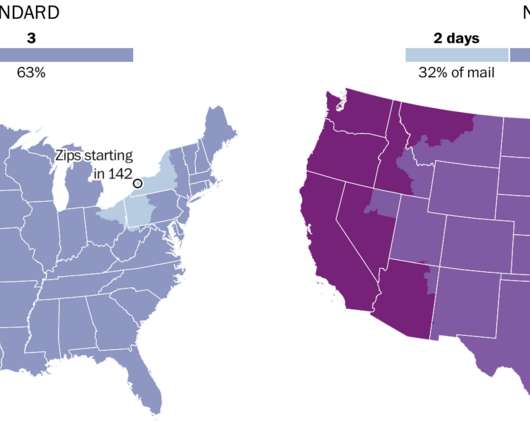
Postmaster General Louis DeJoy proposed new standards for first-class mail, which would slow down how long it takes for you to receive a letter. The Washington Post made an interactive (paywall) to see how the plan would change delivery times from your ZIP code. Tags: slowdown , USPS , Washington Post.
Speaker: Chris Townsend, VP of Product Marketing, Wellspring
Over the past decade, companies have embraced innovation with enthusiasm—Chief Innovation Officers have been hired, and in-house incubators, accelerators, and co-creation labs have been launched. CEOs have spoken with passion about “making everyone an innovator” and the need “to disrupt our own business.” But after years of experimentation, senior leaders are asking: Is this still just an experiment, or are we in it for the long haul?
Those who watched the vision presentation at the recent AI Experience 2021 event might have noticed that we quietly announced a new MLOps feature called Continuous AI. I want to take some time and drill into this feature in a little more detail. First off, I won’t call it a feature again. Calling something a feature diminishes its value, and Continuous AI is too important for that.
ArticleVideo Book This article was published as a part of the Data Science Blogathon Machine Learning Operations (MLOps) is the primary way to increase the. The post MLOps : Machine Learning Operations in Microsoft Azure appeared first on Analytics Vidhya.
Click to learn more about author Anne Hardy. Artificial intelligence (AI) is no longer the future – it’s already in our homes, cars, and pockets. As technology expands its role in our lives, an important question has emerged: What level of trust can – and should – we place in these AI systems? Trust is […]. The post New EU AI Regulations Are Turning CISOs into Ambassadors of Trust appeared first on DATAVERSITY.
Aerial photographer Lior Patel followed a herd of sheep in Yokneam. The results are much more interesting than they sound. [via Colossal ]. See also the work of Tim Whittaker who produced a video of the same ilk. I don’t know what to call it, but I am very much into this genre of calming sheep herding videos for the mind. Although I feel like herding up close must be kind of stressful.
Speaker: Ben Epstein, Stealth Founder & CTO | Tony Karrer, Founder & CTO, Aggregage
When tasked with building a fundamentally new product line with deeper insights than previously achievable for a high-value client, Ben Epstein and his team faced a significant challenge: how to harness LLMs to produce consistent, high-accuracy outputs at scale. In this new session, Ben will share how he and his team engineered a system (based on proven software engineering approaches) that employs reproducible test variations (via temperature 0 and fixed seeds), and enables non-LLM evaluation m
In 2016, Greater Manchester became the first city region in the United Kingdom to take full control of its combined health and social care budgets – a sum of more than £6 billion. Greater Manchester Health and Social Care Partnership is the body made up of the National Health Service (NHS) organizations and councils in the city region that is overseeing the work.
ArticleVideo Book This article was published as a part of the Data Science Blogathon In the age of relational databases, Joining and Merging tables is. The post Join the DataFrames like SQL tables in Python using Pandas appeared first on Analytics Vidhya.
Click to learn more about author Juras Jurš?nas. Not all machine learning applications have been met with resounding success. In fact, there’s a lot of disappointment involved. From overly ambitious projects to the expectation of ever being a finished product, machine learning is marred with false hope. I think Andrey Kurenkov has done a stellar […].
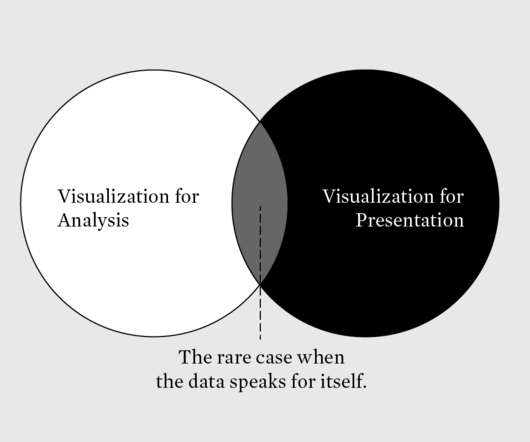
Welcome to issue #146 of The Process , the newsletter for FlowingData members about how the charts get made. I’m Nathan Yau, and this week I’m thinking about one of my least favorite types of visualization: the chart meant for analysis standing in for a chart meant for presentation. Become a member for access to this — plus tutorials, courses, and guides.
In this new webinar, Tamara Fingerlin, Developer Advocate, will walk you through many Airflow best practices and advanced features that can help you make your pipelines more manageable, adaptive, and robust. She'll focus on how to write best-in-class Airflow DAGs using the latest Airflow features like dynamic task mapping and data-driven scheduling!
Input your email to sign up, or if you already have an account, log in here!
Enter your email address to reset your password. A temporary password will be e‑mailed to you.
We organize all of the trending information in your field so you don't have to. Join 17,000+ users and stay up to date on the latest articles your peers are reading.
You know about us, now we want to get to know you!
Let's personalize your content
Let's get even more personalized
We recognize your account from another site in our network, please click 'Send Email' below to continue with verifying your account and setting a password.


Let's personalize your content