This site uses cookies to improve your experience. To help us insure we adhere to various privacy regulations, please select your country/region of residence. If you do not select a country, we will assume you are from the United States. Select your Cookie Settings or view our Privacy Policy and Terms of Use.
Cookie Settings
Cookies and similar technologies are used on this website for proper function of the website, for tracking performance analytics and for marketing purposes. We and some of our third-party providers may use cookie data for various purposes. Please review the cookie settings below and choose your preference.
Used for the proper function of the website
Used for monitoring website traffic and interactions
Cookie Settings
Cookies and similar technologies are used on this website for proper function of the website, for tracking performance analytics and for marketing purposes. We and some of our third-party providers may use cookie data for various purposes. Please review the cookie settings below and choose your preference.
Strictly Necessary: Used for the proper function of the website
Performance/Analytics: Used for monitoring website traffic and interactions
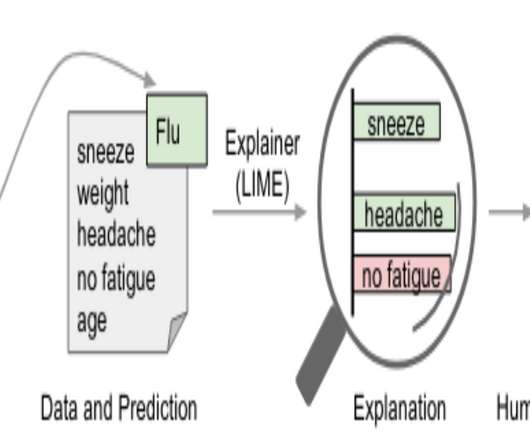
ArticleVideo Book This article was published as a part of the Data Science Blogathon eXplainable AI(XAI) What does Interpretability/Explainability mean in AI? The following points. The post Beginner’s Guide to Machine Learning Explainability appeared first on Analytics Vidhya.
This article was originally published on Grit Daily and is reproduced with permission. The financial crisis of 2007 – 2008 resulted in marked changes to the institutional financial sector landscape. Weaknesses were brought to light and financial institutions were forced to reevaluate how they were managing data and restructure as.
Although machine learning is still in its infancy, it is developing at a breathtaking pace to improve the reach of artificial intelligence. Since this type of advanced technology is at the cutting edge of industrial innovation, many large companies invest heavily in artificial intelligence and machine learning research. These tech giants are learning how to improve these technologies and simultaneously trying to figure out various implementations for them going forward.
Apache Airflow® 3.0, the most anticipated Airflow release yet, officially launched this April. As the de facto standard for data orchestration, Airflow is trusted by over 77,000 organizations to power everything from advanced analytics to production AI and MLOps. With the 3.0 release, the top-requested features from the community were delivered, including a revamped UI for easier navigation, stronger security, and greater flexibility to run tasks anywhere at any time.
ArticleVideo Book This article was published as a part of the Data Science Blogathon Table of Contents: What is CNN, Why is it important Biological. The post All you need to know about Convolutional Neural Networks! appeared first on Analytics Vidhya.
Like oil or money, data is a valuable resource that holds great potential. But too many organizations set their sights on amassing data, or worse, using it only in isolated processes or departments when they should be focused on applying data throughout their everyday operations. Technology is, of course, part.
Francois Ajenstat. Chief Product Officer, Tableau. Spencer Czapiewski. June 17, 2021 - 10:18pm. June 29, 2021. When it comes to asking questions of their data, how comfortable are most people in your organization? Even with a deep understanding of the business, if your users can’t find the right data or navigate dashboards to answer their questions, they aren’t likely to embrace analytics for making decisions.
Francois Ajenstat. Chief Product Officer, Tableau. Spencer Czapiewski. June 17, 2021 - 10:18pm. June 29, 2021. When it comes to asking questions of their data, how comfortable are most people in your organization? Even with a deep understanding of the business, if your users can’t find the right data or navigate dashboards to answer their questions, they aren’t likely to embrace analytics for making decisions.
Data-driven organizations are looking for new ways to use data technology to improve their operations. Unfortunately, they don’t always look at every opportunity to leverage it. Pre-employment background checks are not meant as a burden for the HR department, and they’re an effective tool to increase productivity and profits. One bad hire can cost a company quite a lot.
ArticleVideo Book This article was published as a part of the Data Science Blogathon Introduction Have you ever visited this website? The name of the. The post A Detailed Explanation of GAN with Implementation Using Tensorflow and Keras appeared first on Analytics Vidhya.
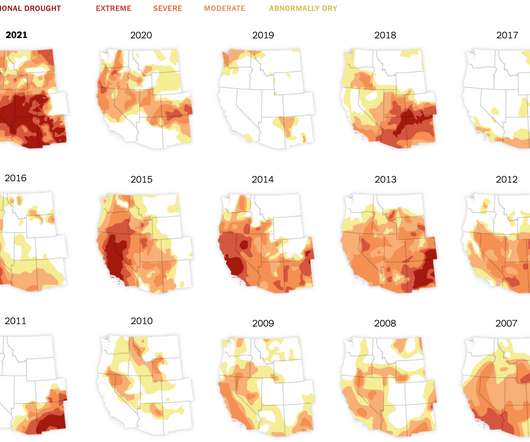
In what’s become a recurring theme almost every year, the western United States is experiencing drought, much of it exceptional or extreme. Nadja Popovich for The New York Times has the small multiple maps to show June conditions each year since 2000. Tags: climate change , drought , Nadja Popovich , New York Times.
Britt Staniar. Senior Community Program Manager, Recognition Programs. Ateken Abla. June 15, 2021 - 9:28pm. June 30, 2021. Drumroll, please: Nominations and applications for the 2021 Tableau Ambassador Program are now open! We’ve curated all you need to know about the program, including what ambassadors do, community feedback and program changes, and how to nominate or apply.
Speaker: Alex Salazar, CEO & Co-Founder @ Arcade | Nate Barbettini, Founding Engineer @ Arcade | Tony Karrer, Founder & CTO @ Aggregage
There’s a lot of noise surrounding the ability of AI agents to connect to your tools, systems and data. But building an AI application into a reliable, secure workflow agent isn’t as simple as plugging in an API. As an engineering leader, it can be challenging to make sense of this evolving landscape, but agent tooling provides such high value that it’s critical we figure out how to move forward.
How companies gather, manage and control data has undeniably become one of the most important aspects of business success today. It’s estimated that every human being creates at least 1.7 MB of data per second , and with each click, swipe, view, purchase, and shipment, your business collects more information on its customers that you can use to help manage your business more efficiently and drive more revenue.
ArticleVideo Book This article was published as a part of the Data Science Blogathon Introduction Sometimes it is just convenient to leave the driving to. The post Uber and Lyft Cab Prices : Data Analysis and Visualization appeared first on Analytics Vidhya.
This looks promising : While it is often easy, and tempting, to write a scraper as a dirty one-off script, spatula makes an attempt to provide an easy framework that most scrapers fit within without additional overhead. This reflects the reality that many scraper projects start small but grow quickly, so reaching for a heavyweight tool from the start often does not seem practical.
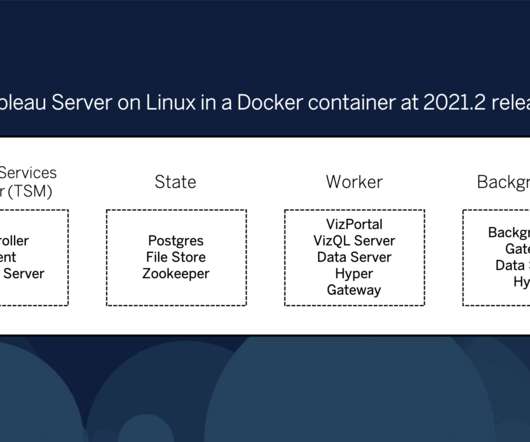
Bernhard Damberger. Product Management Senior Manager. Spencer Czapiewski. June 17, 2021 - 2:07am. June 18, 2021. We are excited to announce that with the release of Tableau 2021.2, you can now deploy and run Tableau Server for Linux using Docker containers and Kubernetes! This unlocks a new and streamlined way to deploy and manage Tableau Server in the cloud and when embedded in applications, as well as introduces efficiencies to testing Tableau Server.
Speaker: Andrew Skoog, Founder of MachinistX & President of Hexis Representatives
Manufacturing is evolving, and the right technology can empower—not replace—your workforce. Smart automation and AI-driven software are revolutionizing decision-making, optimizing processes, and improving efficiency. But how do you implement these tools with confidence and ensure they complement human expertise rather than override it? Join industry expert Andrew Skoog as he explores how manufacturers can leverage automation to enhance operations, streamline workflows, and make smarter, data-dri
Big data is becoming very important for companies all over the world. They need to make sure that they utilize their data wisely, because it is one of the most important assets at their disposal. There are a lot of things that companies need to take into consideration when managing their data. One of the most important is selecting the right web hosting plan.
ArticleVideo Book This article was published as a part of the Data Science Blogathon ANN – General Introduction: Artificial Neural Networks (ANN)are the basic algorithms. The post Artificial Neural Networks – Better Understanding ! appeared first on Analytics Vidhya.
Michael Friendly and Howard Wainer have a new book out: A History of Data Visualization and Graphic Communication. They rewind back 400 years and discuss the beginnings of visualization, when nobody knew what a chart was. Putting this in my queue and hoping it’s back in stock soon. Visualization still seems like a relatively new thing. It’s old.
Data Governance describes the practices and processes organizations use to manage the access, use, quality and security of an organizations data assets. The data-driven business era has seen a rapid rise in the value of organization’s data resources. This has led to greater interest in leveraging Data Governance to ensure that best practices are followed […].
Documents are the backbone of enterprise operations, but they are also a common source of inefficiency. From buried insights to manual handoffs, document-based workflows can quietly stall decision-making and drain resources. For large, complex organizations, legacy systems and siloed processes create friction that AI is uniquely positioned to resolve.
Many industries are benefiting from changes in data analytics. The call center industry is one of them. Call center analytics is changing the industry immensely. However, data analytics isn’t guaranteed to solve all call center challenges without the right strategy in place. Some people think that the call center software industry has the potential to grow exponentially but this is not the case.
ArticleVideo Book This article was published as a part of the Data Science Blogathon Web Scraping with Python It is the path toward get-together information. The post Web Scraping with Python For Your Data Science project ! appeared first on Analytics Vidhya.
It’s hot here in the western United States, and it’s only mid-June. From The Washington Post, we’re stuck in a heat dome : Hot air masses expand vertically into the atmosphere, creating a dome of high pressure that diverts weather systems around them. One way to gauge the magnitude of a heat wave is to measure the height of the typical halfway point of the atmosphere — at the 500 millibar pressure level.
Juha Teljo. VP Solution Engineering, Tableau. Kristin Adderson. June 15, 2021 - 1:22pm. June 15, 2021. We know that data-driven businesses are more resilient and more confident. But how do you get there? To enable transformation across the business, Chief Information Officers (CIO) need to tell memorable data stories to the board and to the business, says Juha Teljo, Tableau VP of Solution Engineering.
Speaker: Chris Townsend, VP of Product Marketing, Wellspring
Over the past decade, companies have embraced innovation with enthusiasm—Chief Innovation Officers have been hired, and in-house incubators, accelerators, and co-creation labs have been launched. CEOs have spoken with passion about “making everyone an innovator” and the need “to disrupt our own business.” But after years of experimentation, senior leaders are asking: Is this still just an experiment, or are we in it for the long haul?
Artificial intelligence is radically changing the future of many businesses. They are using machine learning to solve a number of complex problems. However, it is important to make sure that you understand the potential role of AI and what business model to build around it. The market for AI is projected to reach $267 billion in the next six years due to the countless benefits it provides.
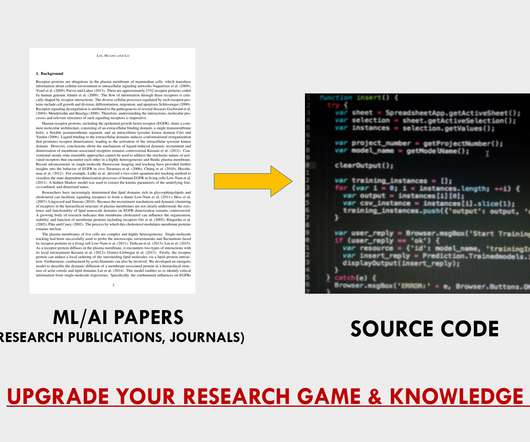
ArticleVideo Book This article was published as a part of the Data Science Blogathon Okay! I know that stealing is a crime and we should. The post Steal the code (ethically) and get better at ML/AI research appeared first on Analytics Vidhya.
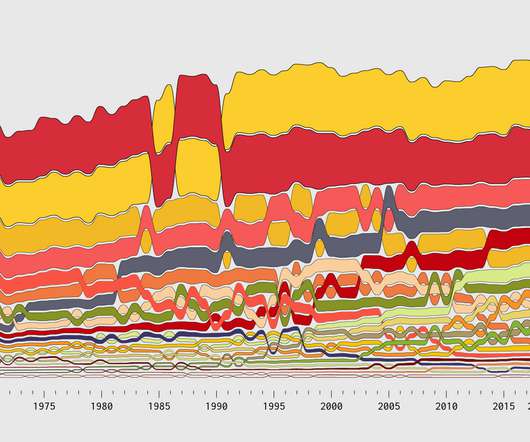
An alluvial diagram is a type of flow chart that is useful to show change over time. You see how individual categories and how the composition of the categories shift. Incorporate ranking into the mix at each time segment, and you get a good idea of how order changes over time too. The geometry is like a combination of a stacked bar chart and a bump chart.
Sue Kraemer. Curriculum Development Manager, Tableau. Kristin Adderson. June 16, 2021 - 11:07pm. June 17, 2021. Students who master data skills will have an advantage in their future careers. Enterprises are increasingly becoming data-driven—and requiring data literacy skills for employees in every part of the organization. To meet this demand, academic institutions are now asked to prepare students with these skills as they enter the workforce.
Speaker: Ben Epstein, Stealth Founder & CTO | Tony Karrer, Founder & CTO, Aggregage
When tasked with building a fundamentally new product line with deeper insights than previously achievable for a high-value client, Ben Epstein and his team faced a significant challenge: how to harness LLMs to produce consistent, high-accuracy outputs at scale. In this new session, Ben will share how he and his team engineered a system (based on proven software engineering approaches) that employs reproducible test variations (via temperature 0 and fixed seeds), and enables non-LLM evaluation m
Big data technology is changing the way companies around the world are operating. One of the biggest advantages of big data is that it has improved the quality of remote work. Before recent advances in data technology, remote work wasn’t regarded to have the same status as working in an office. Many assume that when you work outside the office, you’re less likely to be productive.
ArticleVideo Book This article was published as a part of the Data Science Blogathon Introduction Hello readers. This is Part 2 in the series of. The post A comprehensive tutorial on Deep Learning – Part 2 appeared first on Analytics Vidhya.
To measure drought in the present day, we use data from sensors that constantly record environmental conditions, such as soil moisture, precipitation, and snow water content. But to measure drought thousands of years ago, researchers can use tree rings. Alvin Chang for The Guardian shows how the researchers line up old rings to gather historical data and then do that across a region.
Neal Myrick. Global Head of the Tableau Foundation. Kristin Adderson. June 13, 2021 - 5:55pm. June 13, 2021. When word reached Senegal of the COVID-19 pandemic spreading across the globe, health practitioners in the country immediately thought back to what happened during the Ebola crisis of 2014.”There was a real fear that this new disease would lead to lethality similar to Ebola,” says Dr Alioune Badara Ly, the Deputy Director of the Health Emergency Operations Centre, Ministère de la Santé et
In this new webinar, Tamara Fingerlin, Developer Advocate, will walk you through many Airflow best practices and advanced features that can help you make your pipelines more manageable, adaptive, and robust. She'll focus on how to write best-in-class Airflow DAGs using the latest Airflow features like dynamic task mapping and data-driven scheduling!
Input your email to sign up, or if you already have an account, log in here!
Enter your email address to reset your password. A temporary password will be e‑mailed to you.
We organize all of the trending information in your field so you don't have to. Join 17,000+ users and stay up to date on the latest articles your peers are reading.
You know about us, now we want to get to know you!
Let's personalize your content
Let's get even more personalized
We recognize your account from another site in our network, please click 'Send Email' below to continue with verifying your account and setting a password.


Let's personalize your content