This site uses cookies to improve your experience. To help us insure we adhere to various privacy regulations, please select your country/region of residence. If you do not select a country, we will assume you are from the United States. Select your Cookie Settings or view our Privacy Policy and Terms of Use.
Cookie Settings
Cookies and similar technologies are used on this website for proper function of the website, for tracking performance analytics and for marketing purposes. We and some of our third-party providers may use cookie data for various purposes. Please review the cookie settings below and choose your preference.
Used for the proper function of the website
Used for monitoring website traffic and interactions
Cookie Settings
Cookies and similar technologies are used on this website for proper function of the website, for tracking performance analytics and for marketing purposes. We and some of our third-party providers may use cookie data for various purposes. Please review the cookie settings below and choose your preference.
Strictly Necessary: Used for the proper function of the website
Performance/Analytics: Used for monitoring website traffic and interactions
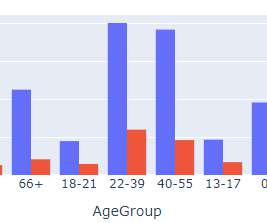
In this blog, we will discuss exploratory data analysis, also known as EDA, and why it is important. To put it simply, the goal of EDA is to discover underlying patterns, structures, and trends in the datasets and drive meaningful insights from them that would help in driving important business decisions. DSD got you covered!
Before conducting any formal statistical analysis, it’s important to conduct exploratory data analysis (EDA) to better understand the data and identify any patterns or relationships. EDA is an approach that involves using graphical and numerical methods to summarize and visualize the data. We can use summary statistics to do this.
Introduction Data Analysis transforms raw data into valuable insights that drive informed decisions. Data Analysis examines, cleans, transforms, and models data to extract meaningful information. Role in Extracting Insights from Raw Data Raw data is often complex and unorganised, making it difficult to derive useful information.
From website clicks and social media interactions to sales figures and scientific measurements, information pours in from every direction. Data Analysis is the systematic process of inspecting, cleaning, transforming, modelling, and interpreting data to discover useful information, draw conclusions, and support decision-making.
Understanding Data Science Data Science involves analysing and interpreting complex data sets to uncover valuable insights that can inform decision-making and solve real-world problems. They collect, clean, and analyse data to extract actionable insights that help organisations make informed decisions.
Statistics Understand descriptive statistics (mean, median, mode) and inferential statistics (hypothesistesting, confidence intervals). Seaborn Built on top of Matplotlib, Seaborn simplifies the creation of attractive and informative statistical graphics. These concepts help you analyse and interpret data effectively.
By conducting exploratory data analysis (EDA), they will identify relationships between these variables and generate insights on how strategy impacts race outcomes. Participants will use EDA and statistical analysis to understand how tire management and pit stop decisions impact race outcomes.
This technique is widely used across various fields, including economics, finance, biology, engineering, and social sciences, to make predictions and inform decision-making. It helps in understanding relationships between variables, making predictions, and informing decision-making processes.
Data scientists, on the other hand, extract valuable information from complex datasets to make data-driven decisions. At the core of Data Science lies the art of transforming raw data into actionable information that can guide strategic decisions. Statistical Analysis: Hypothesistesting, probability, regression analysis, etc.
Here are some key areas often assessed: Programming Proficiency Candidates are often tested on their proficiency in languages such as Python, R, and SQL, with a focus on data manipulation, analysis, and visualization. It forms the basis for many statistical tests and estimators used in hypothesistesting and confidence interval estimation.
In Inferential Statistics, you can learn P-Value , T-Value , HypothesisTesting , and A/B Testing , which will help you to understand your data in the form of mathematics. For Data Analysis you can focus on such topics as Feature Engineering , Data Wrangling , and EDA which is also known as Exploratory Data Analysis.
By understanding crucial concepts like Machine Learning, Data Mining, and Predictive Modelling, analysts can communicate effectively, collaborate with cross-functional teams, and make informed decisions that drive business success. Data Science is the art and science of extracting valuable information from data. What is Data Science?
We organize all of the trending information in your field so you don't have to. Join 17,000+ users and stay up to date on the latest articles your peers are reading.
You know about us, now we want to get to know you!
Let's personalize your content
Let's get even more personalized
We recognize your account from another site in our network, please click 'Send Email' below to continue with verifying your account and setting a password.


Let's personalize your content