article thumbnail

Exploratory Data Analysis: A Guide with Examples

Mlearning.ai

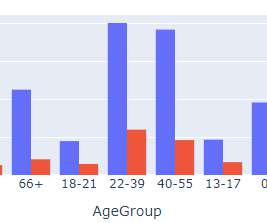
Before conducting any formal statistical analysis, it’s important to conduct exploratory data analysis (EDA) to better understand the data and identify any patterns or relationships. EDA is an approach that involves using graphical and numerical methods to summarize and visualize the data. We can use summary statistics to do this.

article thumbnail

From Data to Decisions: Deep Dive into Workshop Learnings

Women in Big Data

Hypothesis Testing in Action: We learned how to formulate a null hypothesis (no difference exists) and an alternative hypothesis (a difference exists) and use statistical tests to evaluate their validity. EDA involves techniques like: Identifying different types of variables (categorical, numerical).

professionals

Sign Up for our Newsletter

This site is protected by reCAPTCHA and the Google Privacy Policy and Terms of Service apply.

article thumbnail

Mastering Exploratory Data Analysis (EDA): A comprehensive guide

Data Science Dojo

In this blog, we will discuss exploratory data analysis, also known as EDA, and why it is important. EDA is an iterative process of conglomerative activities which include data cleaning, manipulation and visualization. We will also be sharing code snippets so you can try out different analysis techniques yourself. DSD got you covered!

article thumbnail

Top 10 Data Science Interviews Questions and Expert Answers

Pickl AI

Here are some key areas often assessed: Programming Proficiency Candidates are often tested on their proficiency in languages such as Python, R, and SQL, with a focus on data manipulation, analysis, and visualization. It forms the basis for many statistical tests and estimators used in hypothesis testing and confidence interval estimation.

article thumbnail

The Data Dilemma: Exploring the Key Differences Between Data Science and Data Engineering

Pickl AI

Exploratory Data Analysis (EDA) EDA is a crucial step where Data Scientists visually explore and analyze the data to identify patterns, trends, and potential correlations. Statistical Analysis: Hypothesis testing, probability, regression analysis, etc. Data Visualization: Matplotlib, Seaborn, Tableau, etc.

article thumbnail

Roadmap to Learn Data Science for Beginners and Freshers in 2023

Becoming Human

In Inferential Statistics, you can learn P-Value , T-Value , Hypothesis Testing , and A/B Testing , which will help you to understand your data in the form of mathematics. For Data Analysis you can focus on such topics as Feature Engineering , Data Wrangling , and EDA which is also known as Exploratory Data Analysis.

article thumbnail

Building ML Platform in Retail and eCommerce

The MLOps Blog

Exploratory data analysis The purpose of having an EDA layer is to find out any obvious error or outlier in the data. are captured and compared by formulating a hypothesis test to conclude with statistical significance. In this layer, we need to set up a set of visualisations to monitor statistical parameters from the data.

ML 59