Remove Data Visualization Remove Machine Learning Remove White paper
article thumbnail

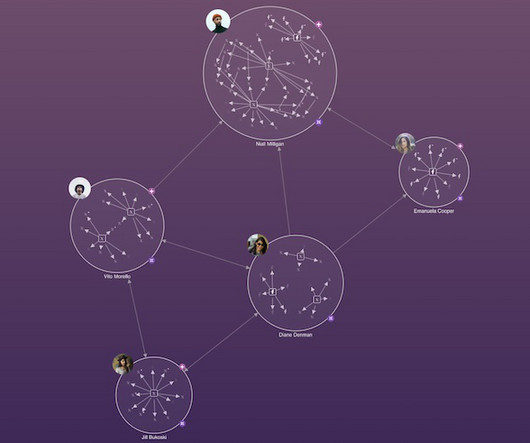
Enterprise fraud management, AI and data visualization

Cambridge Intelligence

But AI and machine learning has emerged as a game changer for anti-fraud platforms. FREE: Graph visualization and artificial intelligence white paper Find out how successful businesses work with the latest graph visualization and AI technologies to make fast, business-critical decisions.

article thumbnail

AI and data visualization: Powering the intelligence cycle

Cambridge Intelligence

Artificial intelligence is changing the way organizations think about data analysis. AI and data visualization can do a lot of the heavy lifting for analysts and investigators working with connected data – helping them detect, understand and even predict risks and threats.

professionals

Sign Up for our Newsletter

This site is protected by reCAPTCHA and the Google Privacy Policy and Terms of Service apply.

article thumbnail

How Big Data Leads To Improvements In Company Letterhead Designs

Smart Data Collective

A number of companies have written detailed articles on the utilization of data visualization with graphics. However, big data can be effective in more rudimentary designs as well. There are a lot of effective ways to use big data to make better designs. However, they still need to employ the right design principles.

Big Data 100
article thumbnail

3 new & easy ways to simplify complex data visualizations

Cambridge Intelligence

Rectangular combos offer a clear, space-efficient option for complex infrastructure networks Another key part of modern cloud security applications is their use of AI and machine learning to create timely and accurate alerts. Request full access to our SDKs, demos and live-coding playgrounds.

article thumbnail

Responsible AI Relies on Data Literacy

DataRobot

What Is Data Literacy? Data literacy is the ability to understand data science and AI applications critically using basic data visualization, communication, and reasoning skills. The distinction between various data roles: Understanding data roles (i.e., WHITE PAPER. Download Now.

article thumbnail

Graph visualization use cases

Cambridge Intelligence

The challenge to understand hidden relationships and uncover actionable insights from data is universal, across countless data visualization use cases. In this blog post, we focus on seven of the most popular: Why visualize data as a graph? Data visualization makes it easy for us to identify trends and outliers.

article thumbnail

Link analysis: 6 trends shaping the future

Cambridge Intelligence

Although AI technologies have improved the speed and accuracy of intelligence operations, getting better at detecting threat, spotting anomalies and even recommending courses of action, those alerts and recommendations are worthless without data visualization to make them explainable and understandable to the human decision-maker.