This site uses cookies to improve your experience. To help us insure we adhere to various privacy regulations, please select your country/region of residence. If you do not select a country, we will assume you are from the United States. Select your Cookie Settings or view our Privacy Policy and Terms of Use.
Cookie Settings
Cookies and similar technologies are used on this website for proper function of the website, for tracking performance analytics and for marketing purposes. We and some of our third-party providers may use cookie data for various purposes. Please review the cookie settings below and choose your preference.
Used for the proper function of the website
Used for monitoring website traffic and interactions
Cookie Settings
Cookies and similar technologies are used on this website for proper function of the website, for tracking performance analytics and for marketing purposes. We and some of our third-party providers may use cookie data for various purposes. Please review the cookie settings below and choose your preference.
Strictly Necessary: Used for the proper function of the website
Performance/Analytics: Used for monitoring website traffic and interactions
Architecturally the introduction of Hadoop, a file system designed to store massive amounts of data, radically affected the cost model of data. Organizationally the innovation of self-service analytics, pioneered by Tableau and Qlik, fundamentally transformed the user model for data analysis. Disruptive Trend #1: Hadoop.
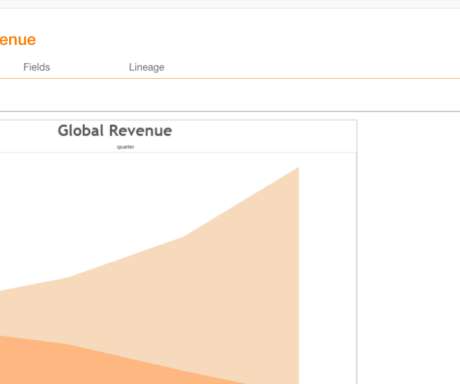
A “catalog-first” approach to business intelligence enables both empowerment and accuracy; and Alation has long enabled this combination over Tableau. Alation’s deep integration with tools like MicroStrategy and Tableau provides visibility into the complete data pipeline: from storage through visualization. Subscribe to Alation's Blog.
Whether you’re a seasoned tech professional looking to switch lanes, a fresh graduate planning your career trajectory, or simply someone with a keen interest in the field, this blog post will walk you through the exciting journey towards becoming a data scientist. It’s time to turn your question into a quest.
With blogs, anyone can now write and distribute an article and with message boards anyone can post an advertisement. Today, you have Tableau, empowering any analyst to create a report. Whether using Tableau, Informatica, Excel, MicroStrategy, Hadoop or Teradata to store or prepare data, data is all over the place.
And you should have experience working with big data platforms such as Hadoop or Apache Spark. js and Tableau Data science, data analytics and IBM Practicing data science isn’t without its challenges. Your skill set should include the ability to write in the programming languages Python, SAS, R and Scala.
In this blog, we will explore the arena of data science bootcamps and lay down a guide for you to choose the best data science bootcamp. Tools like Tableau, Power BI, and Python libraries such as Matplotlib and Seaborn are commonly taught. These bootcamps are focused training and learning platforms for people.
With expertise in programming languages like Python , Java , SQL, and knowledge of big data technologies like Hadoop and Spark, data engineers optimize pipelines for data scientists and analysts to access valuable insights efficiently. Data Visualization: Matplotlib, Seaborn, Tableau, etc. Big Data Technologies: Hadoop, Spark, etc.
More than 300 data analysts and 5,000 business users were accessing eBay’s analytics platform directly and through more than 10,000 reports in Tableau and 5,000 in MicroStrategy. Subscribe to Alation's Blog. Download White Paper. Get the latest data cataloging news and trends in your inbox.
This blog aims to provide a comprehensive overview of a typical Big Data syllabus, covering essential topics that aspiring data professionals should master. Some of the most notable technologies include: Hadoop An open-source framework that allows for distributed storage and processing of large datasets across clusters of computers.
This blog explores how Big Data is redefining marketing materials to meet evolving objectives. Role of Analytics Tools in Big Data Analytics tools like Hadoop , Tableau , and predictive platforms make Big Data manageable. The global Big Data analytics market, valued at $307.51 billion in 2023, is projected to surge to $924.39
This meant a large Hadoop deployment, self-service analytics tools available to every employee with Tableau, and a data catalog from Alation. A team of data stewards certify reports and dashboards for accuracy and publish Unified Data Sets to all employees for use in tools like Tableau. Subscribe to Alation's Blog.
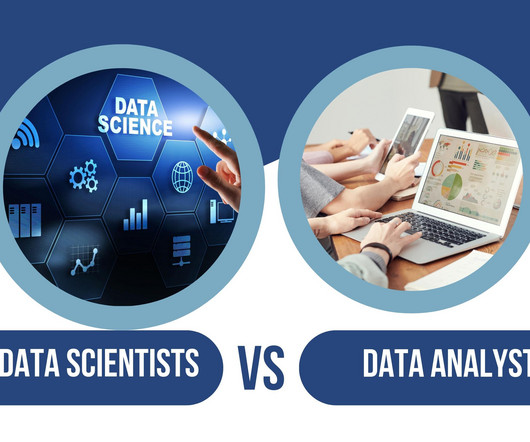
At length, use Hadoop, Spark, and tools like Pig and Hive to develop big data infrastructures. Data Analyst vs Data Scientist: Required Skills Some common skills necessary for Data Analysts and Data Scientists include Data Mining , Data Warehousing , Math, Statistics, Computer Science, Tableau and Data Visualisation. Wrapping Up!
This blog provides a comprehensive roadmap for aspiring Data Scientists, highlighting the essential skills required to succeed in this constantly changing field. By the end of this blog, you will feel empowered to explore the exciting world of Data Science and achieve your career goals.
If you, too, are looking to make a career as a data professional, this blog will take you through some of the best-paying cities for Data Scientists. The hockey stick growth of Data Scientist salary in India is one of the contributing reasons to make it the most preferred career choice. Let’s unveil the answer in the next segment.
The following blog will discuss the familiar Data Science challenges professionals face daily. Some of the tools used by Data Science in 2023 include statistical analysis system (SAS), Apache, Hadoop, and Tableau. Conclusion Thus, the above blog has provided you with the everyday challenges in Data Science.
In this blog, we will explore the components, benefits, and examples of BI architecture while keeping the language simple and easy to understand. By consolidating data from over 10,000 locations and multiple websites into a single Hadoop cluster, Walmart can analyse customer purchasing trends and optimize inventory management.
Summary This blog post demystifies data science for business leaders. This blog post serves as a cheat sheet for business leaders, providing a high-level understanding of data science, its applications, and how to leverage it for success. Hadoop/Spark: Frameworks for distributed storage and processing of big data.
In our previous blog, Data Mesh vs. Data Fabric: A Love Story , we defined data fabric and outlined its uses and motivations. In this blog, we will focus on the “integrated layer” part of this definition by examining each of the key layers of a comprehensive data fabric in more detail. Spoiler alert!
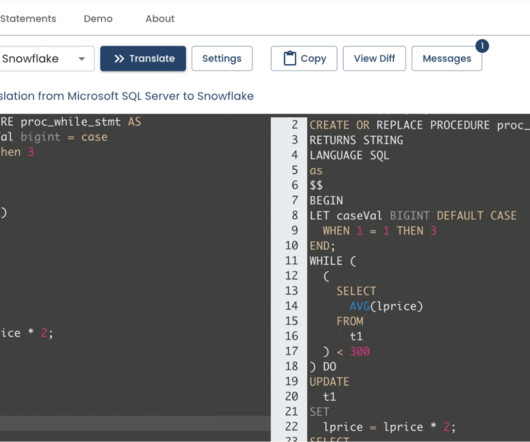
In this blog, we’re going to answer these questions and more. You’re in luck because this blog is for anyone ready to move or thinking about moving to Snowflake who wants to know what’s in store for them. What kinds of differences am I going to find between my old system and Snowflake? Read them all. We have you covered !
Some of the top Data Science courses for Kids with Python have been mentioned in this blog for you. Tools such as Matplotlib, Seaborn, and Tableau may help you in creating useful visualisations that make challenging data more readily available and understandable to others. Read below to find out! Why learn Python for Data Science?
This blog explores the current state of Data Science, emerging trends, the role of generative AI, decision-making enhancements, ethical challenges, essential skills for future Data Scientists, and predictions for the next decade. Learn to use tools like Tableau, Power BI, or Matplotlib to create compelling visual representations of data.
Check next blog : Data science courses in Bangalore 3. It also provides abundant opportunities for data science job seekers. The average base salary in Bangalore is between ₹ 4.0 Lakhs to ₹ 25.0 Lakhs, with an average annual salary of ₹ 10.0 It contributes significantly to the data science job market.
Packages like dplyr, data.table, and sparklyr enable efficient data processing on big data platforms such as Apache Hadoop and Apache Spark. Esquisse: One of the most essential tableau features that has been introduced within the R libraries is Esquisse. You can simply drag and drop to complete your visualisation in minutes.
In der Parallelwelt der ITler wurde das Tool und Ökosystem Apache Hadoop quasi mit Big Data beinahe synonym gesetzt. Oktober 2014 ↑ The post Big Data – Das Versprechen wurde eingelöst appeared first on Data Science Blog. Big Data tauchte als Buzzword meiner Recherche nach erstmals um das Jahr 2011 relevant in den Medien auf.
In this blog, well explore the best data engineering tools that make data work easier, faster, and more reliable. TableauTableau is a popular data visualization tool that enables users to create interactive dashboards and reports. Hadoop : An open-source framework for processing Big Data across multiple servers.
We organize all of the trending information in your field so you don't have to. Join 17,000+ users and stay up to date on the latest articles your peers are reading.
You know about us, now we want to get to know you!
Let's personalize your content
Let's get even more personalized
We recognize your account from another site in our network, please click 'Send Email' below to continue with verifying your account and setting a password.


Let's personalize your content