This site uses cookies to improve your experience. To help us insure we adhere to various privacy regulations, please select your country/region of residence. If you do not select a country, we will assume you are from the United States. Select your Cookie Settings or view our Privacy Policy and Terms of Use.
Cookie Settings
Cookies and similar technologies are used on this website for proper function of the website, for tracking performance analytics and for marketing purposes. We and some of our third-party providers may use cookie data for various purposes. Please review the cookie settings below and choose your preference.
Used for the proper function of the website
Used for monitoring website traffic and interactions
Cookie Settings
Cookies and similar technologies are used on this website for proper function of the website, for tracking performance analytics and for marketing purposes. We and some of our third-party providers may use cookie data for various purposes. Please review the cookie settings below and choose your preference.
Strictly Necessary: Used for the proper function of the website
Performance/Analytics: Used for monitoring website traffic and interactions
While this basic model still applies to enterprise fraud management today, the increasing use of artificialintelligence – by both fraudsters and fraud prevention teams – introduces new complexities. The post Enterprise fraud management, AI and datavisualization appeared first on Cambridge Intelligence.
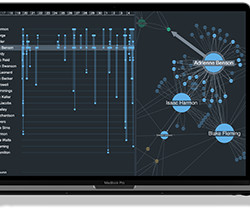
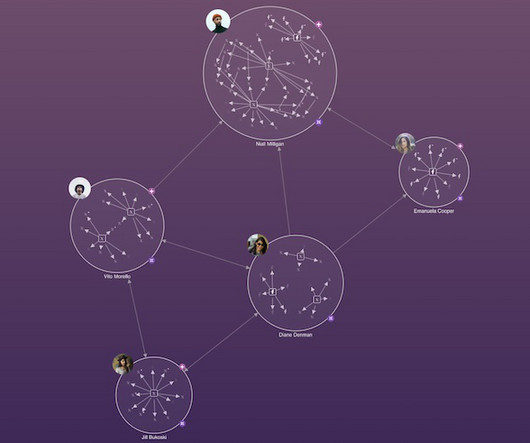
Artificialintelligence is changing the way organizations think about data analysis. AI and datavisualization can do a lot of the heavy lifting for analysts and investigators working with connected data – helping them detect, understand and even predict risks and threats.
Overlaying AI-generated data enhances the effectiveness of graph visualizations and reveals an attack path inside the cloud network FREE: Graph visualization and artificialintelligencewhitepaper Find out how successful businesses work with the latest graph visualization and AI technologies to make fast, business-critical decisions.
Data literacy is a key component for any organization to be able to scale responsible and trusted artificialintelligence technology. What Is Data Literacy? Data literacy is the ability to understand data science and AI applications critically using basic datavisualization, communication, and reasoning skills.
Although AI technologies have improved the speed and accuracy of intelligence operations, getting better at detecting threat, spotting anomalies and even recommending courses of action, those alerts and recommendations are worthless without datavisualization to make them explainable and understandable to the human decision-maker.
We organize all of the trending information in your field so you don't have to. Join 17,000+ users and stay up to date on the latest articles your peers are reading.
You know about us, now we want to get to know you!
Let's personalize your content
Let's get even more personalized
We recognize your account from another site in our network, please click 'Send Email' below to continue with verifying your account and setting a password.


Let's personalize your content