Remove Analytics Remove Exploratory Data Analysis Remove Power BI
article thumbnail

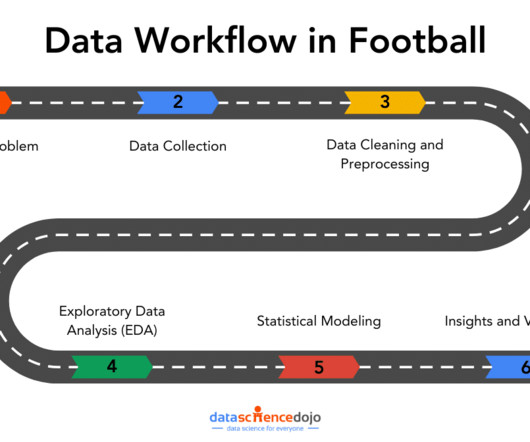
Data Workflows in Football Analytics: From Questions to Insights

Data Science Dojo

In this article, well explore how that workflow covering aspects from data collection to data visualizations can tackle the real-world challenges. Whether youre passionate about football or data, this journey highlights how smart analytics can increase performance.

Power BI 195
article thumbnail

Cloud Data Science News #2

Data Science 101

Google Releases a tool for Automated Exploratory Data Analysis Exploring data is one of the first activities a data scientist performs after getting access to the data. This command-line tool helps to determine the properties and quality of the data as well the predictive power.

professionals

Sign Up for our Newsletter

This site is protected by reCAPTCHA and the Google Privacy Policy and Terms of Service apply.

article thumbnail

Turn the face of your business from chaos to clarity

Dataconomy

It ensures that the data used in analysis or modeling is comprehensive and comprehensive. Integration also helps avoid duplication and redundancy of data, providing a comprehensive view of the information. EDA provides insights into the data distribution and informs the selection of appropriate preprocessing techniques.

article thumbnail

Top 50+ Data Analyst Interview Questions & Answers

Pickl AI

Additionally, it delves into case study questions, advanced technical topics, and scenario-based queries, highlighting the skills and knowledge required for success in data analytics roles. Additionally, we’ve got your back if you consider enrolling in the best data analytics courses.

article thumbnail

Popular Statistician certifications that will ensure professional success

Pickl AI

Programs like Pickl.AI’s Data Science Job Guarantee Course promise data expertise including statistics, Power BI , Machine Learning and guarantee job placement upon completion. The dedicated Statistics module focussing on Exploratory Data Analysis, Probability Theory, and Inferential Statistics.

article thumbnail

Data Analysis vs. Data Visualization – More Than Just Pretty Charts

Pickl AI

Summary: Data Analysis focuses on extracting meaningful insights from raw data using statistical and analytical methods, while data visualization transforms these insights into visual formats like graphs and charts for better comprehension. Deep Dive: What is Data Analysis?

article thumbnail

Importance of Tableau for Data Science

Pickl AI

A Data Scientist requires to be able to visualize quickly the data before creating the model and Tableau is helpful for that. You can perform basic statistical analysis, such as calculating measures of central tendency, variance, and correlation.

Tableau 52