Remove 2021 Remove Data Analysis Remove Data Visualization
article thumbnail

Top Python Libraries to Automate Exploratory Data Analysis in 2021

Analytics Vidhya

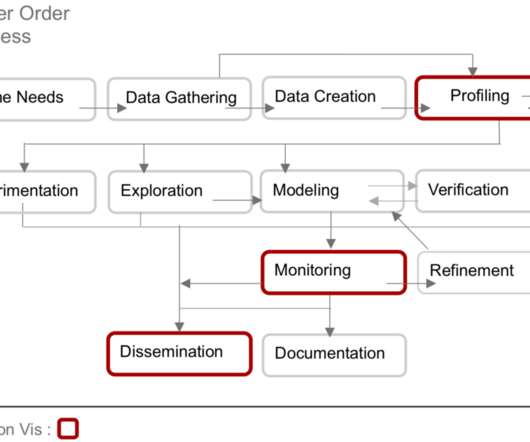
ArticleVideo Book This article was published as a part of the Data Science Blogathon. Topic to be covered What is Exploratory Data Analysis What. The post Top Python Libraries to Automate Exploratory Data Analysis in 2021 appeared first on Analytics Vidhya.

article thumbnail

Is GPT-4 Getting Any Better At Quantitative Image Analysis?

Towards AI

Can it do decent quantitative analysis from a data visualization? For me, one of the most useful GPT-4 tools is the ability to analyze and interpret image data. But how good it this tool now with charting data and with map images? Join thousands of data leaders on the AI newsletter.

professionals

Sign Up for our Newsletter

This site is protected by reCAPTCHA and the Google Privacy Policy and Terms of Service apply.

article thumbnail

Is GPT-4 Getting Any Better At Quantitative Image Analysis?

Towards AI

Can it do decent quantitative analysis from a data visualization? For me, one of the most useful GPT-4 tools is the ability to analyze and interpret image data. But how good it this tool now with charting data and with map images? Join thousands of data leaders on the AI newsletter.

article thumbnail

6 lessons learned about data communication from the Iron Viz 2021 Feeder

Tableau

August 20, 2021 - 10:08pm. August 21, 2021. Last week I had the honor of announcing the winners of the 2021 Iron Viz feeder competition. It can be tempting to go a long way and hack Tableau to create non-standard charts with deep visual appeal and a significant “wow” factor. Andy Cotgreave. Bronwen Boyd.

Tableau 114
article thumbnail

Tableau partners with the government of India to build students’ data skills

Tableau

July 19, 2021 - 11:09pm. July 20, 2021. Data skills are important for all. Our mission is to lower the barrier of entry to learning analytics and build data literacy skills in future generations. . In partnership with AICTE, we will help equip the future workforce of India with these critical data skills.

Tableau 137
article thumbnail

6 lessons learned about data communication from the Iron Viz 2021 Feeder

Tableau

August 20, 2021 - 10:08pm. August 21, 2021. Last week I had the honor of announcing the winners of the 2021 Iron Viz feeder competition. It can be tempting to go a long way and hack Tableau to create non-standard charts with deep visual appeal and a significant “wow” factor. Andy Cotgreave. Bronwen Boyd.

Tableau 98
article thumbnail

11 Open Source Data Exploration Tools You Need to Know in 2023

ODSC - Open Data Science

There are many well-known libraries and platforms for data analysis such as Pandas and Tableau, in addition to analytical databases like ClickHouse, MariaDB, Apache Druid, Apache Pinot, Google BigQuery, Amazon RedShift, etc. Data visualization can help here by visualizing your datasets.