Remove 2020 Remove Data Preparation Remove Data Visualization
article thumbnail

My GPT-4 Prompting Methods: The Why And How For Data Visualization

Towards AI

My methods of using GPT-4 to optimize my data visual workflow For the past 6 months, I have been a heavy daily GPT-4 user. I know it makes me sound like an addict, but I have found many good reasons and many excellent use cases where this tool is an invaluable resource for improving my data workflow.

article thumbnail

Tableau: 9 years a Leader in Gartner Magic Quadrant for Analytics and Business Intelligence Platforms

Tableau

With your input, we released more than 200 new capabilities across the Tableau platform in 2020. In every release, we're making Tableau easier to use, more powerful, and simpler to deploy to support governed data and analytics at scale. In 2020, we added the ability to write to external databases so you can use clean data anywhere.

Tableau 102
professionals

Sign Up for our Newsletter

This site is protected by reCAPTCHA and the Google Privacy Policy and Terms of Service apply.

article thumbnail

Tableau: 9 years a Leader in Gartner Magic Quadrant for Analytics and Business Intelligence Platforms

Tableau

With your input, we released more than 200 new capabilities across the Tableau platform in 2020. In every release, we're making Tableau easier to use, more powerful, and simpler to deploy to support governed data and analytics at scale. In 2020, we added the ability to write to external databases so you can use clean data anywhere.

Tableau 52
article thumbnail

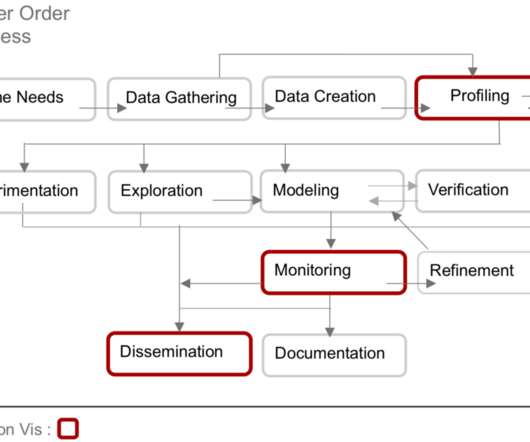
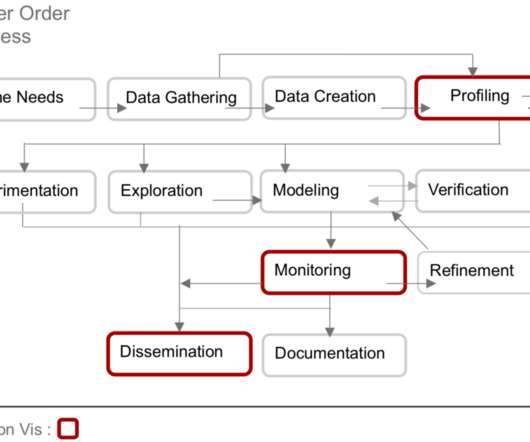
Reflecting on a decade of data science and the future of visualization tools

Tableau

In this blog post, I summarize several of the key takeaways from this research paper and share my thoughts on how its findings can help us build the next generation of data visualization tools for data science. . What is data science? It turns out data science is different things to different people.