This site uses cookies to improve your experience. To help us insure we adhere to various privacy regulations, please select your country/region of residence. If you do not select a country, we will assume you are from the United States. Select your Cookie Settings or view our Privacy Policy and Terms of Use.
Cookie Settings
Cookies and similar technologies are used on this website for proper function of the website, for tracking performance analytics and for marketing purposes. We and some of our third-party providers may use cookie data for various purposes. Please review the cookie settings below and choose your preference.
Used for the proper function of the website
Used for monitoring website traffic and interactions
Cookie Settings
Cookies and similar technologies are used on this website for proper function of the website, for tracking performance analytics and for marketing purposes. We and some of our third-party providers may use cookie data for various purposes. Please review the cookie settings below and choose your preference.
Strictly Necessary: Used for the proper function of the website
Performance/Analytics: Used for monitoring website traffic and interactions
Read a comprehensive SQL guide for dataanalysis; Learn how to choose the right clustering algorithm for your data; Find out how to create a viral DataViz using the data from Data Science Skills poll; Enroll in any of 10 Free Top Notch Natural Language Processing Courses; and more.
Also: Kannada-MNIST: A new handwritten digits dataset in ML town; Math for Programmers; The 4 Quadrants of Data Science Skills and 7 Principles for Creating a Viral DataVisualization; The Last SQL Guide for DataAnalysis You’ll Ever Need.
Also: Activation maps for deep learning models in a few lines of code; The 4 Quadrants of Data Science Skills and 7 Principles for Creating a Viral DataVisualization; OpenAI Tried to Train AI Agents to Play Hide-And-Seek but Instead They Were Shocked by What They Learned; 10 Great Python Resources for Aspiring Data Scientists.
The Data Scientist profession today is often considered to be one of the most promising and lucrative. The Bureau of Labor Statistics estimates that the number of data scientists will increase from 32,700 to 37,700 between 2019 and 2029. What is Data Science? Data Mining Techniques and DataVisualization.
Several stages of analysis are needed to find insights and make the right decisions related to data, one of which is datavisualization. Datavisualization is an essential part of the dataanalysis process, as it helps to make sense of large and complex data sets. 2] Matplotlib 3.7.0
My story (The Shift from Jupyter Notebooks to VS Code) Throughout early to mid-2019, when I started my data science career, Jupyter Notebooks were my constant companions. Because of its interactive features, it’s ideal for learning and teaching, prototypes, exploratory dataanalysis projects, and visualizations.
Exploratory DataAnalysis Next, we will create visualizations to uncover some of the most important information in our data. The graph also shows that the transaction data exhibits seasonality, where around December and January, the monthly transactions usually drop.
The Salesforce purchase in 2019. Tableau had its IPO at the NYSE with the ticker DATA in 2013. The Salesforce acquisition in August 2019 ended the Tableau board and the last formal Tableau roles for Chris, Pat, and Christian. VizQL: A domain-specific language for visual, self-service analysis. Sept 2019).
Big data has been billed as being the future of business for quite some time. Analysts have found that the market for big data jobs increased 23% between 2014 and 2019. The impact of big data is felt across all sectors of the economy. However, the future is now. The market for Hadoop jobs increased 58% in that timeframe.
Image by Author Tools The following tools were used to assist the dataanalysis process: Tableau: Used to create the visualizations. JupyterHub: Used to wrangle, clean, and prepare the dataset for visualization. Read individual CSV files and combine them on race ID, constructor ID, driver ID, circuit ID, and status ID.
The Salesforce purchase in 2019. Tableau had its IPO at the NYSE with the ticker DATA in 2013. The Salesforce acquisition in August 2019 ended the Tableau board and the last formal Tableau roles for Chris, Pat, and Christian. VizQL: A domain-specific language for visual, self-service analysis. Sept 2019).
Dataanalysis and data communication are fundamental to the way people and businesses understand concepts, make decisions, and create solutions. Anyone who communicates with data needs to be mindful of the impact of the stories they tell. Kristin Adderson. November 29, 2021 - 5:26pm. December 13, 2021.
Solution: Instead, NYSHEX invested in BI, and then they centralized its data into one system. Results: Because of BI implementation in 2019, the company was able to multiply its shipping volume between Asia and U.S. This data is not beneficial until it is churned and filtered. This includes ongoing dataanalysis and feedback.
Dataanalysis and data communication are fundamental to the way people and businesses understand concepts, make decisions, and create solutions. . Anyone who communicates with data needs to be mindful of the impact of the stories they tell. Kristin Adderson. November 29, 2021 - 5:26pm. December 13, 2021.
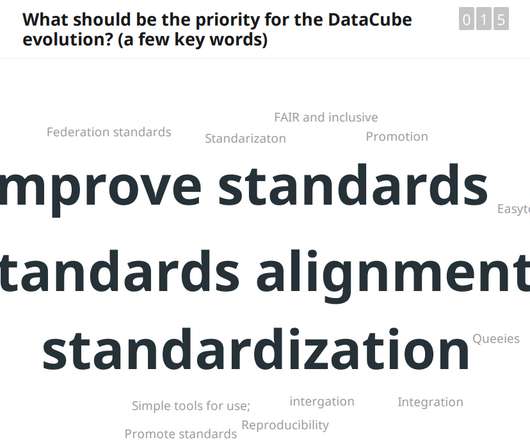
Presenters and participants had the opportunity to hear about and evaluate the pros and cons of different back end technologies and data formats for different uses such as web-mapping, datavisualization, and the sharing of meta-data. Data, 4(3), 92. Achieving the full vision of Earth observation data cubes.
In 2018–2019, while new car sales were recorded at 3.6 As a data scientist at Cars4U, I had to come up with a pricing model that can effectively predict the price of used cars and can help the business in devising profitable strategies using differential pricing. million units, around 4 million second-hand cars were bought and sold.
For example, the Parquet file format can efficiently store and retrieve tabular data. Retrieval Modern machine learning applications require efficient data retrieval by components such as model training, dataanalysis, and application interfaces. Data Management at Scale. O’Reilly Media, Inc
Visualization tools Azure Data Studio includes insightful widgets that help visualize query results. The ability to generate charts and graphs directly from T-SQL queries with JSON output further enhances dataanalysis capabilities. It has a reduced learning curve, helping new users quickly become proficient.
We organize all of the trending information in your field so you don't have to. Join 17,000+ users and stay up to date on the latest articles your peers are reading.
You know about us, now we want to get to know you!
Let's personalize your content
Let's get even more personalized
We recognize your account from another site in our network, please click 'Send Email' below to continue with verifying your account and setting a password.


Let's personalize your content