This site uses cookies to improve your experience. To help us insure we adhere to various privacy regulations, please select your country/region of residence. If you do not select a country, we will assume you are from the United States. Select your Cookie Settings or view our Privacy Policy and Terms of Use.
Cookie Settings
Cookies and similar technologies are used on this website for proper function of the website, for tracking performance analytics and for marketing purposes. We and some of our third-party providers may use cookie data for various purposes. Please review the cookie settings below and choose your preference.
Used for the proper function of the website
Used for monitoring website traffic and interactions
Cookie Settings
Cookies and similar technologies are used on this website for proper function of the website, for tracking performance analytics and for marketing purposes. We and some of our third-party providers may use cookie data for various purposes. Please review the cookie settings below and choose your preference.
Strictly Necessary: Used for the proper function of the website
Performance/Analytics: Used for monitoring website traffic and interactions
Read a comprehensive SQL guide for dataanalysis; Learn how to choose the right clustering algorithm for your data; Find out how to create a viral DataViz using the data from Data Science Skills poll; Enroll in any of 10 Free Top Notch Natural Language Processing Courses; and more.
Choosing the Right Clustering Algorithm for your Dataset; DeepMind Has Quietly Open Sourced Three New Impressive Reinforcement Learning Frameworks; A European Approach to Masters Degrees in Data Science; The Future of Analytics and Data Science. Also: How AI will transform healthcare (and can it fix the US healthcare system?);
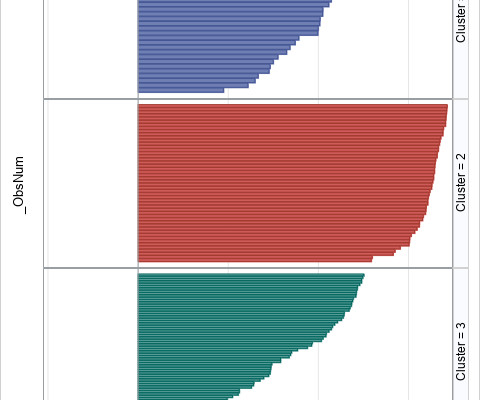
Assigning observations into clusters can be challenging. One challenge is deciding how many clusters are in the data. Another is identifying which observations are potentially misclassified because they are on the boundary between two different clusters. The post What is the silhouette statistic in clusteranalysis?
The Salesforce purchase in 2019. Tableau had its IPO at the NYSE with the ticker DATA in 2013. The Salesforce acquisition in August 2019 ended the Tableau board and the last formal Tableau roles for Chris, Pat, and Christian. VizQL: A domain-specific language for visual, self-service analysis. Sept 2019).
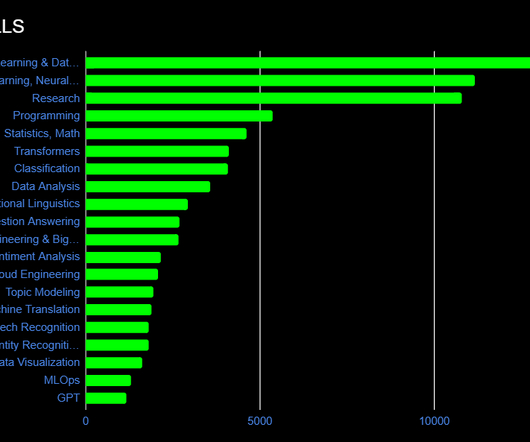
Knowing how spaCy works means little if you don’t know how to apply core NLP skills like transformers, classification, linguistics, question answering, sentiment analysis, topic modeling, machine translation, speech recognition, named entity recognition, and others.
The Salesforce purchase in 2019. Tableau had its IPO at the NYSE with the ticker DATA in 2013. The Salesforce acquisition in August 2019 ended the Tableau board and the last formal Tableau roles for Chris, Pat, and Christian. VizQL: A domain-specific language for visual, self-service analysis. Sept 2019).
In 2018–2019, while new car sales were recorded at 3.6 As a data scientist at Cars4U, I had to come up with a pricing model that can effectively predict the price of used cars and can help the business in devising profitable strategies using differential pricing. million units, around 4 million second-hand cars were bought and sold.
Recently, I became interested in machine learning, so I was enrolled in the Yandex School of DataAnalysis and Computer Science Center. Before I received my master's degree in mathematics from Novosibirsk State University in Russia. Machine learning is my passion and I often participate in competitions.
Solvers submitted a wide range of methodologies to this end, including using open-source and third party LLMs (GPT, LLaMA), clustering (DBSCAN, K-Means), dimensionality reduction (PCA), topic modeling (LDA, BERT), sentence transformers, semantic search, named entity recognition, and more. and DistilBERT.
Following earlier collaborations in 2019 and 2021, this agreement focused on boosting AI supercomputing capabilities and research. Google Cloud was cemented as Anthropic’s preferred provider for computational resources, and they committed to building large-scale TPU and GPU clusters for Anthropic. Read more here 3.
Visualization tools Azure Data Studio includes insightful widgets that help visualize query results. The ability to generate charts and graphs directly from T-SQL queries with JSON output further enhances dataanalysis capabilities. This feature is especially useful for working with SQL Server 2019’s big dataclusters.
We organize all of the trending information in your field so you don't have to. Join 17,000+ users and stay up to date on the latest articles your peers are reading.
You know about us, now we want to get to know you!
Let's personalize your content
Let's get even more personalized
We recognize your account from another site in our network, please click 'Send Email' below to continue with verifying your account and setting a password.


Let's personalize your content