This site uses cookies to improve your experience. To help us insure we adhere to various privacy regulations, please select your country/region of residence. If you do not select a country, we will assume you are from the United States. Select your Cookie Settings or view our Privacy Policy and Terms of Use.
Cookie Settings
Cookies and similar technologies are used on this website for proper function of the website, for tracking performance analytics and for marketing purposes. We and some of our third-party providers may use cookie data for various purposes. Please review the cookie settings below and choose your preference.
Used for the proper function of the website
Used for monitoring website traffic and interactions
Cookie Settings
Cookies and similar technologies are used on this website for proper function of the website, for tracking performance analytics and for marketing purposes. We and some of our third-party providers may use cookie data for various purposes. Please review the cookie settings below and choose your preference.
Strictly Necessary: Used for the proper function of the website
Performance/Analytics: Used for monitoring website traffic and interactions
In this blog, we will discuss exploratorydataanalysis, also known as EDA, and why it is important. We will also be sharing code snippets so you can try out different analysis techniques yourself. This can be useful for identifying patterns and trends in the data. So, without any further ado let’s dive right in.
This article was published as a part of the Data Science Blogathon. Introduction ExploratoryDataAnalysis helps in identifying any outlier data points, understanding the relationships between the various attributes and structure of the data, recognizing the important variables.
Exploratorydataanalysis (EDA) is a critical component of data science that allows analysts to delve into datasets to unearth the underlying patterns and relationships within. EDA serves as a bridge between raw data and actionable insights, making it essential in any data-driven project.
Introduction Imagine you’re working on a dataset to build a Machine Learning model and don’t want to spend too much effort on exploratorydataanalysis codes. You may sometimes find it confusing to sort, filter, or group data to obtain the required information.
This article was published as a part of the Data Science Blogathon What is Hypothesis Testing? Any data science project starts with exploring the data. When we perform an analysis on a sample through exploratorydataanalysis and inferential statistics we get information about the sample.
This article was published as a part of the Data Science Blogathon image source: Author The Importance of Data Visualization A huge amount of data is being generated every instant due to business activities in globalization. ExploratoryDataanalysis can help […].
Models like ChatGPT and LLama can generate text and code, perform exploratorydataanalysis, and automate documentation, which introduces countless opportunities for data science efficiencies. Generative AI (GenAI) has undoubtedly taken the spotlight as this years defining innovation.
Performing exploratorydataanalysis to gain insights into the dataset’s structure. Whether you’re a data scientist aiming to deepen your expertise in NLP or a machine learning engineer interested in domain-specific model fine-tuning, this tutorial will equip you with the tools and insights you need to get started.
Before moving ahead, let me share the official definition mentioned on the internet ExploratoryDataAnalysis (EDA) is a process of analyzing data sets in order to summarize their main characteristics [1][2], often using statistical or graphical techniques. But I didn’t about data science in a way on how it is known.
Summary: ExploratoryDataAnalysis (EDA) uses visualizations to uncover patterns and trends in your data. Histograms, scatter plots, and charts reveal relationships and outliers, helping you understand your data and make informed decisions. Imagine a vast, uncharted territory – your data set.
As data science evolves and grows, the demand for skilled data scientists is also rising. A data scientist’s role is to extract insights and knowledge from data and to use this information to inform decisions and drive business growth.
We have been provided with a dataset that contains that user’s earlier videos engagement score along with their personal information. Introduction In this article, we will be predicting how engaging a video can be at the user level. We will build multiple regression models […]. appeared first on Analytics Vidhya.
In the narrowest view of data visualization, you use charts to pull quick, quantitative information from dashboards and reports. Take a few steps back and you get exploratorydataanalysis and then storytelling. The Art of Insight , by Alberto Cairo, highlights how designers approach visualization with a wide view.
Making visualizations is one of the finest ways for data scientists to explain dataanalysis to people outside the business. Exploratorydataanalysis can help you comprehend your data better, which can aid in future data preprocessing. ExploratoryDataAnalysis What is EDA?
Photo by Joshua Sortino on Unsplash Dataanalysis is an essential part of any research or business project. Before conducting any formal statistical analysis, it’s important to conduct exploratorydataanalysis (EDA) to better understand the data and identify any patterns or relationships.
ExploratoryDataAnalysis on Stock Market Data Photo by Lukas Blazek on Unsplash ExploratoryDataAnalysis (EDA) is a crucial step in data science projects. It helps in understanding the underlying patterns and relationships in the data. pct_change().dropna(),
This method enables analysts and practitioners to create predictive models that can inform decision-making across many fields. The elegance of linear regression lies in its simplicity, making it accessible for those exploring the world of dataanalysis. What is linear regression?
The data sets are categorized according to varying difficulty levels to be suitable for everyone. Understanding fine-tuning, even if not doing it yourself, aids in informed decision-making. We need to communicate with other human beings to deliver information, express our emotions, present ideas, and much more.
You may combine event data (e.g., shot types and results) with tracking data (e.g., Effective data collection ensures you have all the necessary information to begin the analysis, setting the stage for reliable insights into improving shot conversion rates or any other defined problem.
Data scientists play a crucial role in today’s data-driven world, where extracting meaningful insights from vast amounts of information is key to organizational success. Their work blends statistical analysis, machine learning, and domain expertise to guide strategic decisions across various industries.
However, this plethora of information can be used effectively to automatically classify abuse incidents into […]. Following the #MeToo movement we had a lot of people opening up about their sexual harassment incidents, but as with any internet viral movement, it faded with time.
If you’re into the notebook workflow, Observable Plot is a JavaScript library built for you : We created Plot to better support exploratorydataanalysis in reactive, JavaScript notebooks like Observable.
As we delve into 2023, the realms of Data Science, Artificial Intelligence (AI), and Large Language Models (LLMs) continue to evolve at an unprecedented pace. To keep up with these rapid developments, it’s crucial to stay informed through reliable and insightful sources.
Cleaning data: Once the data has been gathered, it needs to be cleaned. This involves removing any errors or inconsistencies in the data. Exploratorydataanalysis (EDA): EDA is a process of exploring data to gain insights into its distribution, relationships, and patterns.
Hosted on the Kaggle platform, the hackathon centered on the theme “Unraveling Mysteries of the Female Brain,” with participants focusing on analyzing women’s brain health data specifically for advancing early ADHD detection and diagnostic capabilities.
Some projects may necessitate a comprehensive LLMOps approach, spanning tasks from data preparation to pipeline production. ExploratoryDataAnalysis (EDA) Data collection: The first step in LLMOps is to collect the data that will be used to train the LLM. What are the benefits of LLMOps?
They employ statistical and mathematical techniques to uncover patterns, trends, and relationships within the data. Data scientists possess a deep understanding of statistical modeling, data visualization, and exploratorydataanalysis to derive actionable insights and drive business decisions.
There are also plenty of data visualization libraries available that can handle exploration like Plotly, matplotlib, D3, Apache ECharts, Bokeh, etc. In this article, we’re going to cover 11 data exploration tools that are specifically designed for exploration and analysis. Output is a fully self-contained HTML application.
Researchers, statisticians, and data analysts rely on histograms to gain insights into data distributions, identify patterns, and detect outliers. Data scientists and machine learning practitioners use histograms as part of exploratorydataanalysis and feature engineering.
Requirements Our solution is hosted on Deepnote , a collaborative data notebook that provides powerful features for data science projects. The dataset originated from Health Verity, one of the largest healthcare data ecosystems in the US. One important stage of any dataanalysis/science project is EDA.
Pipeline, as it sounds, consists of several activities and tools that are used to move data from one system to another using the same method of data processing and storage. Data pipelines automatically fetch information from various disparate sources for further consolidation and transformation into high-performing data storage.
Through each exercise, you’ll learn important data science skills as well as “best practices” for using pandas. By the end of the tutorial, you’ll be more fluent at using pandas to correctly and efficiently answer your own data science questions. Table of Contents: ExploratoryDataAnalysis is all about answering a specific question.
Principal component analysis (PCA) is a powerful technique that has transformed the way data scientists process and analyze information. Purpose of principal component analysis (PCA) Understanding the purpose behind PCA is crucial for its effective application in data processing.
Today’s question is, “What does a data scientist do.” ” Step into the realm of data science, where numbers dance like fireflies and patterns emerge from the chaos of information. In this blog post, we’re embarking on a thrilling expedition to demystify the enigmatic role of data scientists.
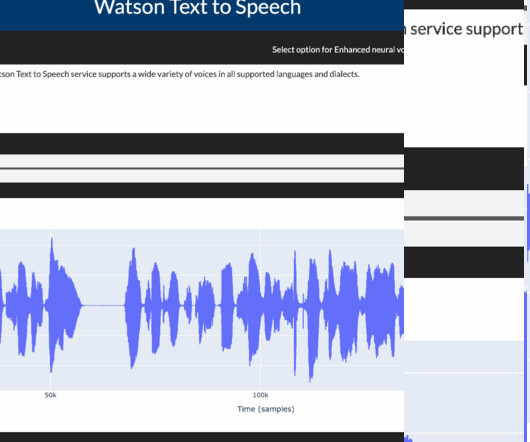
Data Processing and EDA (ExploratoryDataAnalysis) Speech synthesis services require that the data be in a JSON format. For more information, Embeddable AI Webpage. To learn more about using the s ingle-container TTS service you can see here. Those characters must be replaced in the text.
Recognizing the importance of HDB, in this blog we will delve deep to understand Singapore’s HDB resale prices based on a publicly available dataset using data-driven approaches. This dataset is intriguing due to its potential to build a regression model out of it, given its abundance of information from resale prices and related variables.
Discover the power of Python libraries for (partial) automation of ExploratoryDataAnalysis (EDA). These tools empower both seasoned Data Scientists and beginners to explore datasets efficiently, extracting meaningful insights without the usual time constraints. What are auto EDA libraires?
Its flexibility allows you to produce high-quality graphs and charts, making it perfect for exploratoryDataAnalysis. Use cases for Matplotlib include creating line plots, histograms, scatter plots, and bar charts to represent data insights visually.
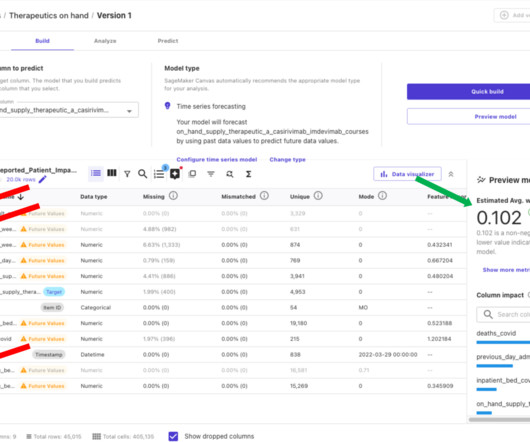
Exploratorydataanalysis After you import your data, Canvas allows you to explore and analyze it, before building predictive models. You can preview your imported data and visualize the distribution of different features. This information can be used to refine your input data and drive more accurate models.
In the following sections, we demonstrate how to perform exploratorydataanalysis and preparation, build the ML forecasting model, and generate predictions using Canvas. The dataset is updated periodically. Conclusion No-code ML tools empower public health experts to quickly and effectively apply ML to public health threats.
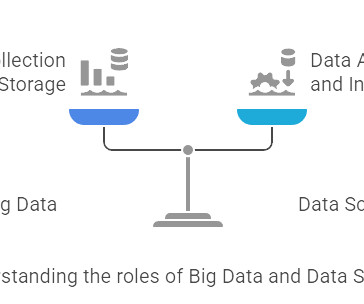
Summary: Big Data refers to the vast volumes of structured and unstructured data generated at high speed, requiring specialized tools for storage and processing. Data Science, on the other hand, uses scientific methods and algorithms to analyses this data, extract insights, and inform decisions.
For access to the data used in this benchmark notebook, sign up for the competition here. While the information gathered from these tasks is invaluable, the manual scoring process limits its potential impact. blending kite KG Step 2: ExploratoryDataAnalysis ¶ We will now explore the dataset and visualize some features.
The research revealed that regardless of whether a neural network is trained to recognize images from popular computer vision datasets like ImageNet or CIFAR, it develops similar internal patterns for processing visual information. Particularly in being extremely good at exploratorydataanalysis.”
The Use of LLMs: An Attractive Solution for DataAnalysis Not only can LLMs deliver dataanalysis in a user-friendly and conversational format “via the most universal interface: Natural Language,” as Satya Nadella, the CEO of Microsoft, puts it, but also they can adapt and tailor their responses to immediate context and user needs.
We organize all of the trending information in your field so you don't have to. Join 17,000+ users and stay up to date on the latest articles your peers are reading.
You know about us, now we want to get to know you!
Let's personalize your content
Let's get even more personalized
We recognize your account from another site in our network, please click 'Send Email' below to continue with verifying your account and setting a password.


Let's personalize your content