This site uses cookies to improve your experience. To help us insure we adhere to various privacy regulations, please select your country/region of residence. If you do not select a country, we will assume you are from the United States. Select your Cookie Settings or view our Privacy Policy and Terms of Use.
Cookie Settings
Cookies and similar technologies are used on this website for proper function of the website, for tracking performance analytics and for marketing purposes. We and some of our third-party providers may use cookie data for various purposes. Please review the cookie settings below and choose your preference.
Used for the proper function of the website
Used for monitoring website traffic and interactions
Cookie Settings
Cookies and similar technologies are used on this website for proper function of the website, for tracking performance analytics and for marketing purposes. We and some of our third-party providers may use cookie data for various purposes. Please review the cookie settings below and choose your preference.
Strictly Necessary: Used for the proper function of the website
Performance/Analytics: Used for monitoring website traffic and interactions
This article was published as a part of the Data Science Blogathon Introduction I have been using Pandas with Python and Plotly to create some of the most stunning dashboards for my projects. In recent times, I have switched to learning Excel as it was a prerequisite in every company I had to apply to. I […]. The post How to Create Stunning and Interactive Dashboards in Excel?
Sustainability is a term thrown about quite often in conversations that we have, in the workplace or at home. The umbrella term sustainability includes depleting resources, increasing temperatures, rising sea levels, and more. The concept of sustainability as we know it today was defined in the 1980s. Since then, it.
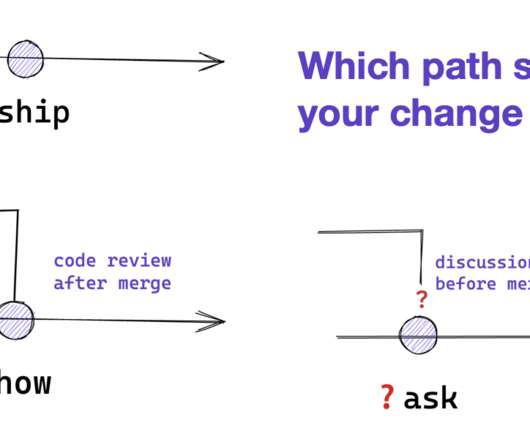
I've written a fair bit about how using pull requests can encourage a low integration frequency, reducing cycle time and discouraging refactoring. Rouan Wilsenach has had success using an approach that categorizes changes as Ship/Show/Ask - using this classification to decide whether and how to use pull requests.
During the beginning of the pandemic, many businesses went digital, and the retail industry is no exception. Technologies became a crucial part of achieving success in the increasingly competitive market, including big data and analytics. Big data in retail help companies understand their customers better and provide them with more personalized offers.
Apache Airflow® 3.0, the most anticipated Airflow release yet, officially launched this April. As the de facto standard for data orchestration, Airflow is trusted by over 77,000 organizations to power everything from advanced analytics to production AI and MLOps. With the 3.0 release, the top-requested features from the community were delivered, including a revamped UI for easier navigation, stronger security, and greater flexibility to run tasks anywhere at any time.
This article was published as a part of the Data Science Blogathon Introduction We all know the phrase: “Every picture can tell us a story” There could be a lot of information hidden inside an image and we could interpret it in different ways and perspectives. So, what is an image, and how to deal with […]. The post A Beginner’s Guide to Image Processing With OpenCV and Python appeared first on Analytics Vidhya.
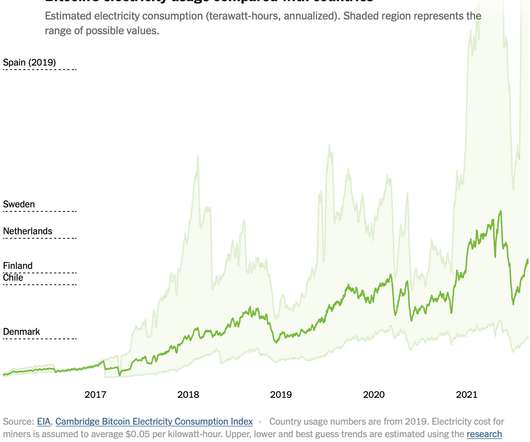
You might have heard that Bitcoin uses a lot of electricity. More than some countries. You might have wondered how that could be possible. The New York Times explains with a set of graphics and illustrations. Tags: Bitcoin , electricity , New York Times.
More and more businesses and organizations treat data as an essential asset. The importance of managing and leveraging data cannot be overestimated. The process of interpreting and analyzing data and putting it into context helps businesses and organizations make informed decisions, predict trends, anticipate expectations, improve security, optimize internal operations, and stay ahead of competitors.
This article was published as a part of the Data Science Blogathon Introduction You may be frequently using Google Assistant or Apple’s Siri or even Amazon Alexa to find out quick answers on the web or to simply command something. These AI assistants are well known for understanding our speech commands and performing the desired tasks. They quickly respond to […].
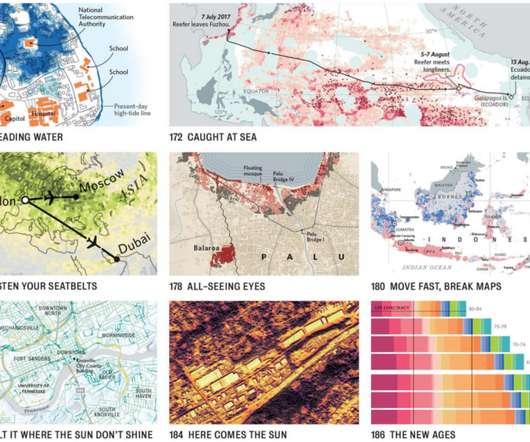
James Cheshire and Oliver Uberti teamed up for another book of maps, Atlas of the Invisible : Sometimes we miss what we can’t step back to see. Sometimes the invisible only appears with the creep of time. And sometimes, in the case of historical events, the visible becomes invisible with the loss of a generation. Graphics give us the power to zoom out, to compare, to remember.
Britt Staniar. Senior Community Program Manager, Recognition Programs. Alyssa Jenson. September 8, 2021 - 6:34pm. September 9, 2021. Tableau Ambassadors evangelize our brand, our products, and our community. The ambassador program recognizes leaders who share our passion for helping people see and understand data—and make the Tableau Community a more vibrant and inclusive place for all.
Speaker: Alex Salazar, CEO & Co-Founder @ Arcade | Nate Barbettini, Founding Engineer @ Arcade | Tony Karrer, Founder & CTO @ Aggregage
There’s a lot of noise surrounding the ability of AI agents to connect to your tools, systems and data. But building an AI application into a reliable, secure workflow agent isn’t as simple as plugging in an API. As an engineering leader, it can be challenging to make sense of this evolving landscape, but agent tooling provides such high value that it’s critical we figure out how to move forward.
You’ve worked hard building your business from the ground up, which is why it’s stressful to know that hackers and other cyber threats lurk on every corner. Data breaches are incredibly costly for companies to deal with, so you want to invest time in ensuring that you’re protecting business and consumer data. It’s vital that you arm yourself with the right tools to avoid hacking, theft, or data loss.
This article was published as a part of the Data Science Blogathon Introduction Deep learning is a subset of Machine Learning and Artificial Intelligence that imitates the way humans gain certain types of knowledge. It is essentially a neural network with three or more layers. deep-learning helps to solve many artificial intelligence applications that help improving […].
Anna Flagg, for NYT’s The Upshot, used dots arranged as a stacked area chart to show the difference between two mortality rates. Each dot represents 10 people, and they start as a random cloud. A transition to show rate by age lends focus to both an absolute and relative count. Tags: Anna Flagg , mortality , race , Upshot.
Britt Staniar. Senior Community Program Manager, Recognition Programs. Alyssa Jenson. September 8, 2021 - 6:34pm. September 9, 2021. Tableau Ambassadors evangelize our brand, our products, and our community. The ambassador program recognizes leaders who share our passion for helping people see and understand data—and make the Tableau Community a more vibrant and inclusive place for all.
Speaker: Andrew Skoog, Founder of MachinistX & President of Hexis Representatives
Manufacturing is evolving, and the right technology can empower—not replace—your workforce. Smart automation and AI-driven software are revolutionizing decision-making, optimizing processes, and improving efficiency. But how do you implement these tools with confidence and ensure they complement human expertise rather than override it? Join industry expert Andrew Skoog as he explores how manufacturers can leverage automation to enhance operations, streamline workflows, and make smarter, data-dri
SMS marketing is one of the most widely used forms of marketing. It’s the process of sending customized messages to consumers to communicate updates, offers, and reminders using automated platforms. SMS marketing is also one of the cheapest marketing techniques, but one with high effectiveness, boasting an open rate of 98%. The unparalleled reach that it provides is due to the vast number of mobile users, which is expected to double—if not triple—in the coming years. (1).
This article was published as a part of the Data Science Blogathon Introduction Q-Q plots are also known as Quantile-Quantile plots. As the name suggests, they plot the quantiles of a sample distribution against quantiles of a theoretical distribution. Doing this helps us determine if a dataset follows any particular type of probability distribution like normal, […].
Welcome to issue #156 of The Process , the newsletter for FlowingData members about how the charts get made. I’m Nathan Yau, and this week I’m wondering if I were to start to learn visualization from the beginning, would I focus more on chart types or visual encodings? Become a member for access to this — plus tutorials, courses, and guides.
Click to learn more about author Ashok Sharma. When it comes to data storage, the temperature must be taken into consideration. The level of layered data storage service, from cold to hot, is described by the temperature setting. The levels are distinguished according to the level of significance for the business – in other words, […]. The post Cold vs.
Documents are the backbone of enterprise operations, but they are also a common source of inefficiency. From buried insights to manual handoffs, document-based workflows can quietly stall decision-making and drain resources. For large, complex organizations, legacy systems and siloed processes create friction that AI is uniquely positioned to resolve.
Machine learning has made app development much easier than ever, even for people without previous coding experience. Once upon a time, coding and developing seemed like it was something hard and far-fetched for anyone with no previous experience. Only those who studied software building, coding, and development could do this, but this isn’t the case anymore.
This article was published as a part of the Data Science Blogathon Introduction Hello everyone, in this article we will pick the use case of sequence modelling, which is time series forecasting. Time series is all around us from predicting sales to predicting traffic and more. A simple example of time series is the amount of […]. The post Web Traffic Forecasting Using Deep Learning appeared first on Analytics Vidhya.
Back to school isn’t just for kids—it’s for anyone who wants to stay on top of industry trends and build their skills in this rapidly changing environment. This is especially important for business analysts and data professionals who want to be expert problem solvers in their organizations. You might be one of them. To remain in high demand and competitive, you know the importance of striving to find effective and efficient ways to solve business problems.
Click to learn more about author Mike Potter. The rush to become data-driven is more heated, important, and pronounced than it has ever been. Businesses understand that if they continue to lead by guesswork and gut feeling, they’ll fall behind organizations that have come to recognize and utilize the power and potential of data. But […]. The post In a Data-Driven Economy, Data “Real Estate” Must Be Modernized appeared first on DATAVERSITY.
Speaker: Chris Townsend, VP of Product Marketing, Wellspring
Over the past decade, companies have embraced innovation with enthusiasm—Chief Innovation Officers have been hired, and in-house incubators, accelerators, and co-creation labs have been launched. CEOs have spoken with passion about “making everyone an innovator” and the need “to disrupt our own business.” But after years of experimentation, senior leaders are asking: Is this still just an experiment, or are we in it for the long haul?
The ETL process is defined as the movement of data from its source to destination storage (typically a Data Warehouse) for future use in reports and analyzes. The data is initially extracted from a vast array of sources before transforming and converting it to a specific format based on business requirements. ETL is one of the most integral processes required by Business Intelligence and Analytics use cases since it relies on the data stored in Data Warehouses to build reports and visualizations
This article was published as a part of the Data Science Blogathon Introduction Everything around us from biology, stocks, physics, or even common life scenarios can be mathematically modelled using Differential equations. It has a remarkable ability to predict everything around us. We can use Differential Equations to maximize our investment returns, can use them in […].
This is the last of the 4-part blog series. In the previous blog , we discussed how Alation provides a platform for data scientists and analysts to complete projects and analysis at speed. In this blog we will discuss how Alation helps minimize risk with active data governance. Now that you have empowered data scientists and analysts to access the Snowflake Data Cloud and speed their modeling and analysis, you need to bolster the effectiveness of your governance models.
Click to learn more about author Eric Polet. As the data-sphere expands in size and value, it becomes even more vulnerable to data loss from such things as cyberattacks, natural disasters, and human error. This has prompted organizations of all sizes to rethink their strategies for achieving both data resiliency and data protection. So, what […].
Speaker: Ben Epstein, Stealth Founder & CTO | Tony Karrer, Founder & CTO, Aggregage
When tasked with building a fundamentally new product line with deeper insights than previously achievable for a high-value client, Ben Epstein and his team faced a significant challenge: how to harness LLMs to produce consistent, high-accuracy outputs at scale. In this new session, Ben will share how he and his team engineered a system (based on proven software engineering approaches) that employs reproducible test variations (via temperature 0 and fixed seeds), and enables non-LLM evaluation m
This article was published as a part of the Data Science Blogathon This is a tutorial on how to create a deep learning model for predicting stock prices using the TensorFlow framework. This is an advanced project of Tensorflow which means you should be very clear with the basics of Stock Prices. You can also check […]. The post Predicting Stock Prices with TensorFlow appeared first on Analytics Vidhya.
Banks collect and manage a lot of sensitive data. The moment an individual opens an account, you’re asking them for information that needs to be protected, from name and address to social security number. And, the data collection doesn’t stop there — rich insights like transactions and purchasing information help to round out customer profiles.
Click to learn more about author Sharad Varshney. A business glossary is a list of data-related terms and definitions, displayed clearly and logically so everyone in an organization can access them. A business glossary is an essential Data Literacy tool and crucial for effective Data Governance. Standardization is one of the major components of Data Literacy and, subsequently, […].
In this new webinar, Tamara Fingerlin, Developer Advocate, will walk you through many Airflow best practices and advanced features that can help you make your pipelines more manageable, adaptive, and robust. She'll focus on how to write best-in-class Airflow DAGs using the latest Airflow features like dynamic task mapping and data-driven scheduling!
Input your email to sign up, or if you already have an account, log in here!
Enter your email address to reset your password. A temporary password will be e‑mailed to you.
We organize all of the trending information in your field so you don't have to. Join 17,000+ users and stay up to date on the latest articles your peers are reading.
You know about us, now we want to get to know you!
Let's personalize your content
Let's get even more personalized
We recognize your account from another site in our network, please click 'Send Email' below to continue with verifying your account and setting a password.


Let's personalize your content