article thumbnail

The Power of Azure ML and Power BI: Dataflows and Model Deployment

Analytics Vidhya

Overview Learn about the integration capabilities of Power BI with Azure Machine Learning (ML) Understand how to deploy machine learning models in a production. The post The Power of Azure ML and Power BI: Dataflows and Model Deployment appeared first on Analytics Vidhya.


Power BI 271
article thumbnail

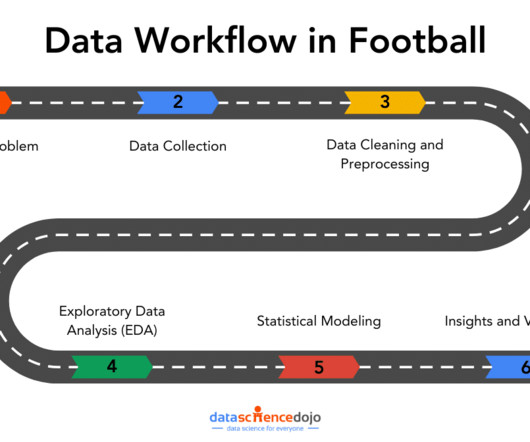
Data Workflows in Football Analytics: From Questions to Insights

Data Science Dojo

In Power BI, you can merge these sources through data transformation, while in Python, libraries like pandas are used to integrate and join different datasets. In Power BI: You can use the Column Profile option to quickly view data completeness, data types, and patterns, helping you detect any inconsistencies early.

Power BI 195
professionals

Sign Up for our Newsletter

This site is protected by reCAPTCHA and the Google Privacy Policy and Terms of Service apply.

article thumbnail

The ultimate guide to the Machine Learning Model Deployment

Data Science Dojo

Exploratory data analysis (EDA): EDA is a process of exploring data to gain insights into its distribution, relationships, and patterns. With the help of the model many insights can be drawn, and they can be visualized using software like Power BI. Cleaning data: Once the data has been gathered, it needs to be cleaned.

article thumbnail

Completing Data Science Tasks in Seconds, Not Minutes

Smart Data Collective

Data analytics tools like Alteryx and Power BI were built to address these usability problems, while also giving users similar power to Python. Easy, Powerful, and Flexible. Mito was specifically designed with all three of our EDA desires in mind! Nobody has ever argued that the pandas syntax is intuitive.

article thumbnail

Turn the face of your business from chaos to clarity

Dataconomy

Exploratory data analysis (EDA) Before preprocessing data, conducting exploratory data analysis is crucial to understand the dataset’s characteristics, identify patterns, detect outliers, and validate missing values. EDA provides insights into the data distribution and informs the selection of appropriate preprocessing techniques.

article thumbnail

Unleash Your Data Insights: Learn from the Experts in Our DataHour Sessions

Analytics Vidhya

Introduction Analytics Vidhya DataHour is designed to provide valuable insights and knowledge to individuals looking to build a career in the data-tech industry. These sessions cover a wide range of topics, from the fields of artificial intelligence, and machine learning, and various topics related to data science.

article thumbnail

Data Analysis vs. Data Visualization – More Than Just Pretty Charts

Pickl AI

Exploratory Data Analysis (EDA): Using statistical summaries and initial visualisations (yes, visualisation plays a role within analysis!) EDA: Calculate overall churn rate. It involves handling missing values, correcting errors, removing duplicates, standardizing formats, and structuring data for analysis.