This site uses cookies to improve your experience. To help us insure we adhere to various privacy regulations, please select your country/region of residence. If you do not select a country, we will assume you are from the United States. Select your Cookie Settings or view our Privacy Policy and Terms of Use.
Cookie Settings
Cookies and similar technologies are used on this website for proper function of the website, for tracking performance analytics and for marketing purposes. We and some of our third-party providers may use cookie data for various purposes. Please review the cookie settings below and choose your preference.
Used for the proper function of the website
Used for monitoring website traffic and interactions
Cookie Settings
Cookies and similar technologies are used on this website for proper function of the website, for tracking performance analytics and for marketing purposes. We and some of our third-party providers may use cookie data for various purposes. Please review the cookie settings below and choose your preference.
Strictly Necessary: Used for the proper function of the website
Performance/Analytics: Used for monitoring website traffic and interactions
In this blog, we will discuss exploratorydataanalysis, also known as EDA, and why it is important. We will also be sharing code snippets so you can try out different analysis techniques yourself. EDA is an iterative process of conglomerative activities which include data cleaning, manipulation and visualization.
Exploratorydataanalysis (EDA) is a critical component of data science that allows analysts to delve into datasets to unearth the underlying patterns and relationships within. EDA serves as a bridge between raw data and actionable insights, making it essential in any data-driven project.
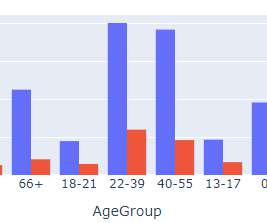
Data exploration serves as the gateway to understanding the wealth of information hidden within datasets. Through careful examination of data, organizations can identify trends, detect anomalies, and derive strategic advantages. Pattern recognition: By generating visual plots, analysts can discover patterns within the data.
Performing exploratorydataanalysis to gain insights into the dataset’s structure. Whether you’re a data scientist aiming to deepen your expertise in NLP or a machine learning engineer interested in domain-specific model fine-tuning, this tutorial will equip you with the tools and insights you need to get started.
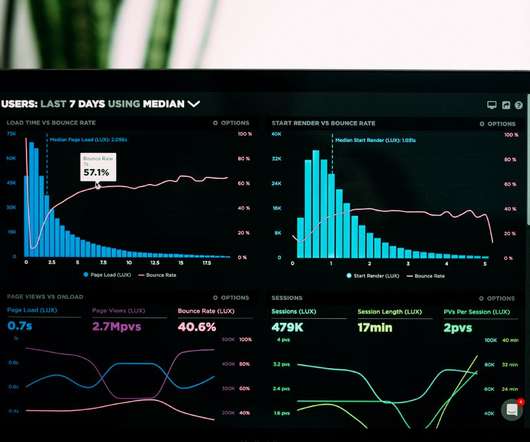
Photo by Luke Chesser on Unsplash EDA is a powerful method to get insights from the data that can solve many unsolvable problems in business. In the increasingly competitive world, understanding the data and taking quicker actions based on that help create differentiation for the organization to stay ahead!
The importance of EDA in the machine learning world is well known to its users. Making visualizations is one of the finest ways for data scientists to explain dataanalysis to people outside the business. Exploratorydataanalysis can help you comprehend your data better, which can aid in future data preprocessing.
You may combine event data (e.g., shot types and results) with tracking data (e.g., Effective data collection ensures you have all the necessary information to begin the analysis, setting the stage for reliable insights into improving shot conversion rates or any other defined problem.
Summary: ExploratoryDataAnalysis (EDA) uses visualizations to uncover patterns and trends in your data. Histograms, scatter plots, and charts reveal relationships and outliers, helping you understand your data and make informed decisions. Imagine a vast, uncharted territory – your data set.
Effective data handling, including preprocessing, exploratorydataanalysis, and making sure data quality, is crucial for creating reliable AI models. R: A powerful tool for statistical analysis and data visualization, R is particularly useful for exploratorydataanalysis and research-focused AI applications.
Cleaning data: Once the data has been gathered, it needs to be cleaned. This involves removing any errors or inconsistencies in the data. Exploratorydataanalysis (EDA): EDA is a process of exploring data to gain insights into its distribution, relationships, and patterns.
Before conducting any formal statistical analysis, it’s important to conduct exploratorydataanalysis (EDA) to better understand the data and identify any patterns or relationships. EDA is an approach that involves using graphical and numerical methods to summarize and visualize the data.
ExploratoryDataAnalysis on Stock Market Data Photo by Lukas Blazek on Unsplash ExploratoryDataAnalysis (EDA) is a crucial step in data science projects. It helps in understanding the underlying patterns and relationships in the data. quantile(0.25) q3 = df['Close'].quantile(0.75)
Discover the power of Python libraries for (partial) automation of ExploratoryDataAnalysis (EDA). These tools empower both seasoned Data Scientists and beginners to explore datasets efficiently, extracting meaningful insights without the usual time constraints. What are auto EDA libraires?
This article seeks to also explain fundamental topics in data science such as EDA automation, pipelines, ROC-AUC curve (how results will be evaluated), and Principal Component Analysis in a simple way. The dataset originated from Health Verity, one of the largest healthcare data ecosystems in the US. Figure 5: Code Magic!
Some projects may necessitate a comprehensive LLMOps approach, spanning tasks from data preparation to pipeline production. ExploratoryDataAnalysis (EDA) Data collection: The first step in LLMOps is to collect the data that will be used to train the LLM. What are the benefits of LLMOps?
There are also plenty of data visualization libraries available that can handle exploration like Plotly, matplotlib, D3, Apache ECharts, Bokeh, etc. In this article, we’re going to cover 11 data exploration tools that are specifically designed for exploration and analysis. Output is a fully self-contained HTML application.
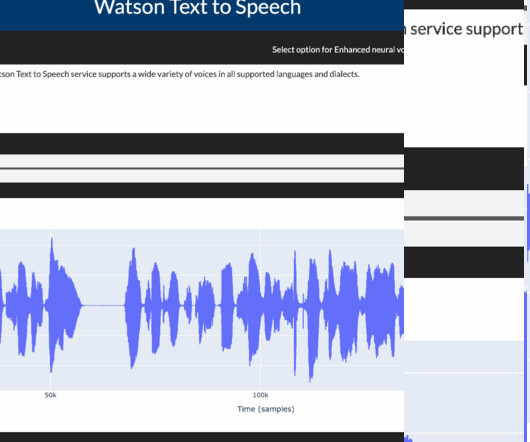
Data Processing and EDA (ExploratoryDataAnalysis) Speech synthesis services require that the data be in a JSON format. For more information, Embeddable AI Webpage. To learn more about using the s ingle-container TTS service you can see here.
Today’s question is, “What does a data scientist do.” ” Step into the realm of data science, where numbers dance like fireflies and patterns emerge from the chaos of information. In this blog post, we’re embarking on a thrilling expedition to demystify the enigmatic role of data scientists.
Key Responsibilities of a Data Scientist in India While the core responsibilities align with global standards, Indian data scientists often face unique challenges and opportunities shaped by the local market: Data Acquisition and Cleaning: Extracting data from diverse sources including legacy systems, cloud platforms, and third-party APIs.
A data analyst deals with a vast amount of information daily. Continuously working with data can sometimes lead to a mistake. In this article, we will be exploring 10 such common mistakes that every data analyst makes. Failing to Communicate Results Effectively Effective communication is paramount for a data analyst.
These figures underscore the significance of comprehending data methodologies for anyone navigating the digital landscape. Understanding Data Science Data Science involves analysing and interpreting complex data sets to uncover valuable insights that can inform decision-making and solve real-world problems.
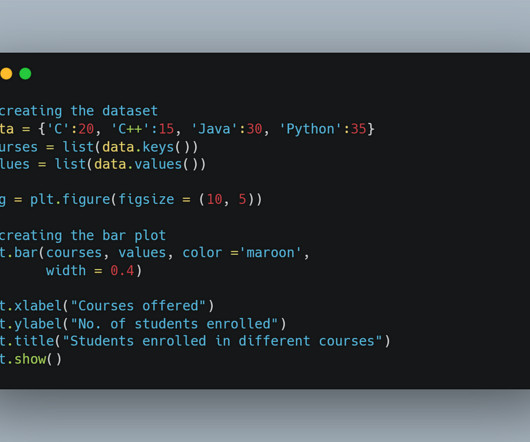
Its flexibility allows you to produce high-quality graphs and charts, making it perfect for exploratoryDataAnalysis. Use cases for Matplotlib include creating line plots, histograms, scatter plots, and bar charts to represent data insights visually.
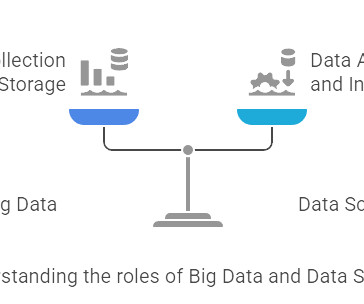
Summary: Big Data refers to the vast volumes of structured and unstructured data generated at high speed, requiring specialized tools for storage and processing. Data Science, on the other hand, uses scientific methods and algorithms to analyses this data, extract insights, and inform decisions.
By analyzing the sentiment of users towards certain products, services, or topics, sentiment analysis provides valuable insights that empower businesses and organizations to make informed decisions, gauge public opinion, and improve customer experiences.
First of all, HR needs to collect comprehensive data about an employee, such as education, salary, experience… We also need data from supervisors such as performance, relationships, promotions… After that, HR can use this information to predict employees’ tendency to leave and take preventive action.
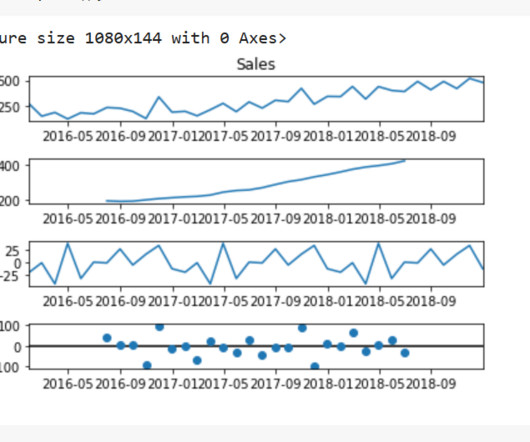
We will carry out some EDA on our dataset, and then we will log the visualizations onto the Comet experimentation website or platform. Time Series Models Time series models are a type of statistical model that are used to analyze and make predictions about data that is collected over time. Without further ado, let’s begin.
Cross-functional barriers, characterized by limited communication and collaboration between teams, can also impede modernization efforts by hindering information sharing. As a leader in ecommerce solutions, they are committed to meeting the high standards of data privacy and regulatory compliance such as CPPA and PCI.
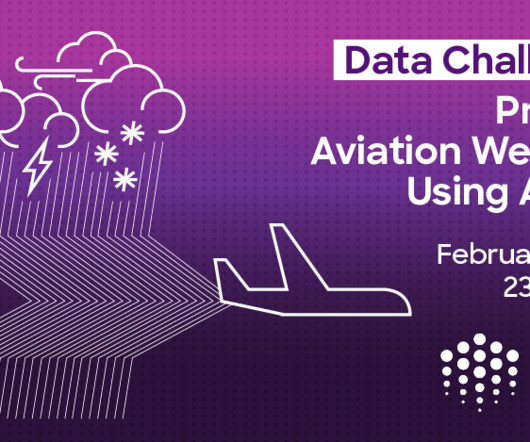
METAR, Miami International Airport (KMIA) on March 9, 2024, at 15:00 UTC In the recently concluded data challenge hosted on Desights.ai , participants used exploratorydataanalysis (EDA) and advanced artificial intelligence (AI) techniques to enhance aviation weather forecasting accuracy.
Introduction DataAnalysis transforms raw data into valuable insights that drive informed decisions. It systematically examines data to uncover patterns, trends, and relationships that help organisations solve problems and make strategic choices.
Data developers no longer have to worry about the limitations of working with large datasets and can focus on analyzing and interpreting the data. In this article, I will provide a detailed overview of Kangas, including information on how to install it and its advantages over other Python libraries.
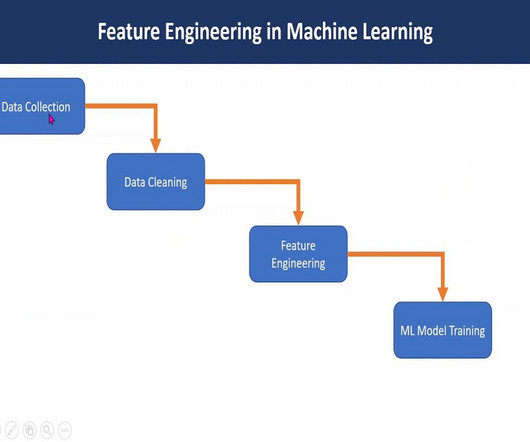
Feature engineering in machine learning is a pivotal process that transforms raw data into a format comprehensible to algorithms. Through ExploratoryDataAnalysis , imputation, and outlier handling, robust models are crafted. Time features Objective: Extracting valuable information from time-related data.
Data Extraction, Preprocessing & EDA & Machine Learning Model development Data collection : Automatically download the stock historical prices data in CSV format and save it to the AWS S3 bucket. Data storage : Store the data in a Snowflake data warehouse by creating a data pipe between AWS and Snowflake.
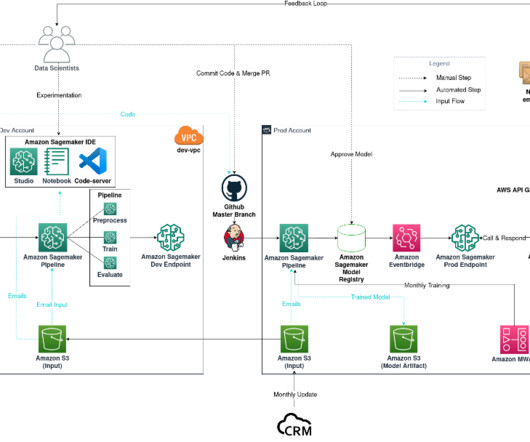
Email classification project diagram The workflow consists of the following components: Model experimentation – Data scientists use Amazon SageMaker Studio to carry out the first steps in the data science lifecycle: exploratorydataanalysis (EDA), data cleaning and preparation, and building prototype models.
Introduction In today’s hyper-connected world, we’re drowning in data. From website clicks and social media interactions to sales figures and scientific measurements, information pours in from every direction. But raw data, in its unprocessed state, is often just noise. Deep Dive: What is DataAnalysis?
F1 :: 2024 Strategy Analysis Poster ‘The Formula 1 Racing Challenge’ challenges participants to analyze race strategies during the 2024 season. They will work with lap-by-lap data to assess how pit stop timing, tire selection, and stint management influence race performance.
The simplicity of the code allows users to quickly visualise trends in their data without complicated syntax, making it a powerful tool for beginners and professionals alike. Seaborn Seaborn, a Python visualisation library built on Matplotlib, provides a high-level interface for creating attractive and informative statistical graphics.
Separately, the company uses AWS data services, such as Amazon Simple Storage Service (Amazon S3), to store data related to patients, such as patient information, device ownership details, and clinical telemetry data obtained from the wearables. For Analysis type , choose Data Quality and Insights Report.
This technique is widely used across various fields, including economics, finance, biology, engineering, and social sciences, to make predictions and inform decision-making. This data can come from various sources such as surveys, experiments, or historical records.
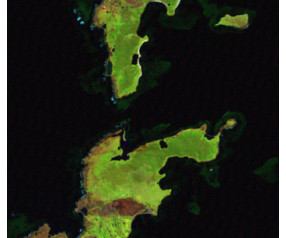
For more information, you can read the competition's Problem Description. I initially conducted detailed exploratorydataanalysis (EDA) to understand the dataset, identifying challenges like duplicate entries and missing Coordinate Reference System (CRS) information.
This is a unique opportunity for data people to dive into real-world data and uncover insights that could shape the future of aviation safety, understanding, airline efficiency, and pilots driving planes. METAR METAR is a format for reporting weather information.
Objectives The challenge embraced several dataanalysis dimensions: from data cleaning and exploratorydataanalysis (EDA) to insightful data visualization and predictive modeling. About Ocean Protocol Ocean was founded to level the playing field for AI and data.
How to Explore and Analyze Mixed-Media Data Quickly and Easily Dr Douglas Blank|Head of Research, Professor Emeritus|Comet, Bryn Mawr College Join this session to learn about a new open-source project called Kangas that allows easy exploration and analysis of data when it is mixed with multimedia datatypes, such as images, video, and audio.
Source:datascientist.com Sentiment analysis, commonly referred to as “opinion mining,” is the method of drawing out irrational information from written or spoken words. Customer service, marketing, and political analysis are just a few of the many uses for sentiment analysis. Let’s get started!
“We engaged with the team of scientists and experts at [the] Amazon Machine Learning Solutions Lab to build a solution for predicting new product sales and understand if and which additional features could help inform [the] decision-making process for optimizing R&D spending. Ultimately, more context leads to lower WAPE values.
We organize all of the trending information in your field so you don't have to. Join 17,000+ users and stay up to date on the latest articles your peers are reading.
You know about us, now we want to get to know you!
Let's personalize your content
Let's get even more personalized
We recognize your account from another site in our network, please click 'Send Email' below to continue with verifying your account and setting a password.


Let's personalize your content