Remove EDA Remove Events Remove Exploratory Data Analysis
article thumbnail

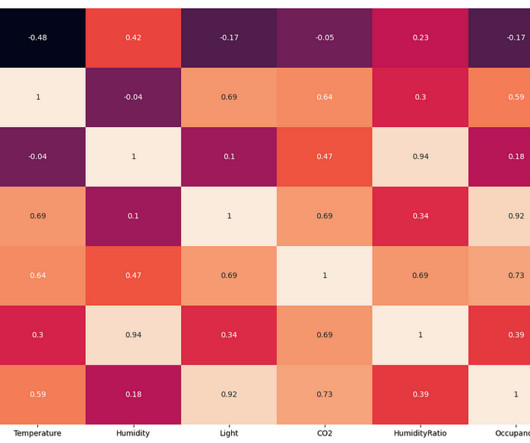
Different Plots Used in Exploratory Data Analysis (EDA)

Heartbeat

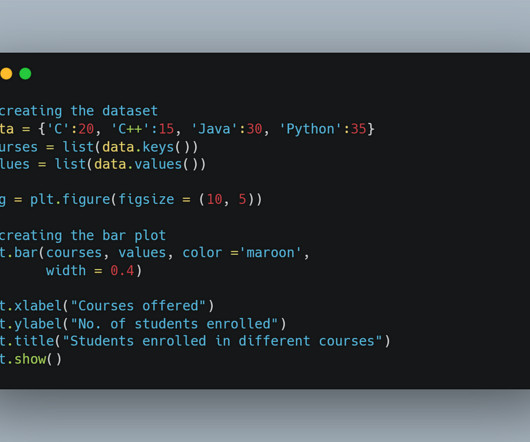
The importance of EDA in the machine learning world is well known to its users. Making visualizations is one of the finest ways for data scientists to explain data analysis to people outside the business. Exploratory data analysis can help you comprehend your data better, which can aid in future data preprocessing.

article thumbnail

Data Workflows in Football Analytics: From Questions to Insights

Data Science Dojo

Data Collection Once the problem is defined, the next step in the data workflow is collecting relevant data. In football analytics, this could mean pulling data from several sources, including event and player performance data. Tracking Data: Player movements and positioning.

Power BI 195
professionals

Sign Up for our Newsletter

This site is protected by reCAPTCHA and the Google Privacy Policy and Terms of Service apply.

article thumbnail

From Data to Decisions: Deep Dive into Workshop Learnings

Women in Big Data

Exploratory Data Analysis (EDA): We unpacked the importance of EDA, the process of uncovering patterns and relationships within your data. It learns from historical data to make predictions about future events. These models act like black boxes, taking inputs and producing outputs.

article thumbnail

How To Learn Python For Data Science?

Pickl AI

Its flexibility allows you to produce high-quality graphs and charts, making it perfect for exploratory Data Analysis. Use cases for Matplotlib include creating line plots, histograms, scatter plots, and bar charts to represent data insights visually.

article thumbnail

Decoding METAR Data: Insights from the Ocean Protocol Data Challenge

Ocean Protocol

METAR, Miami International Airport (KMIA) on March 9, 2024, at 15:00 UTC In the recently concluded data challenge hosted on Desights.ai , participants used exploratory data analysis (EDA) and advanced artificial intelligence (AI) techniques to enhance aviation weather forecasting accuracy.

article thumbnail

Accelerate client success management through email classification with Hugging Face on Amazon SageMaker

AWS Machine Learning Blog

Email classification project diagram The workflow consists of the following components: Model experimentation – Data scientists use Amazon SageMaker Studio to carry out the first steps in the data science lifecycle: exploratory data analysis (EDA), data cleaning and preparation, and building prototype models.

article thumbnail

Curve Finance Data Challenge Review & Insights Research

Ocean Protocol

Abstract This research report encapsulates the findings from the Curve Finance Data Challenge , a competition that engaged 34 participants in a comprehensive analysis of the decentralized finance protocol. Part 1: Exploratory Data Analysis (EDA) MEV Over 25,000 MEV-related transactions have been executed through Curve.