This site uses cookies to improve your experience. To help us insure we adhere to various privacy regulations, please select your country/region of residence. If you do not select a country, we will assume you are from the United States. Select your Cookie Settings or view our Privacy Policy and Terms of Use.
Cookie Settings
Cookies and similar technologies are used on this website for proper function of the website, for tracking performance analytics and for marketing purposes. We and some of our third-party providers may use cookie data for various purposes. Please review the cookie settings below and choose your preference.
Used for the proper function of the website
Used for monitoring website traffic and interactions
Cookie Settings
Cookies and similar technologies are used on this website for proper function of the website, for tracking performance analytics and for marketing purposes. We and some of our third-party providers may use cookie data for various purposes. Please review the cookie settings below and choose your preference.
Strictly Necessary: Used for the proper function of the website
Performance/Analytics: Used for monitoring website traffic and interactions
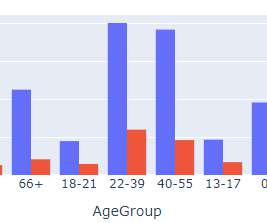
In this blog, we will discuss exploratorydataanalysis, also known as EDA, and why it is important. We will also be sharing code snippets so you can try out different analysis techniques yourself. This can be useful for identifying patterns and trends in the data. So, without any further ado let’s dive right in.
This article was published as a part of the Data Science Blogathon. Introduction ExploratoryDataAnalysis helps in identifying any outlier data points, understanding the relationships between the various attributes and structure of the data, recognizing the important variables.
Exploratorydataanalysis (EDA) is a critical component of data science that allows analysts to delve into datasets to unearth the underlying patterns and relationships within. EDA serves as a bridge between raw data and actionable insights, making it essential in any data-driven project.
This article was published as a part of the Data Science Blogathon image source: Author The Importance of DataVisualization A huge amount of data is being generated every instant due to business activities in globalization. ExploratoryDataanalysis can help […].
Data exploration serves as the gateway to understanding the wealth of information hidden within datasets. Through careful examination of data, organizations can identify trends, detect anomalies, and derive strategic advantages. Pattern recognition: By generating visual plots, analysts can discover patterns within the data.
As data science evolves and grows, the demand for skilled data scientists is also rising. A data scientist’s role is to extract insights and knowledge from data and to use this information to inform decisions and drive business growth.
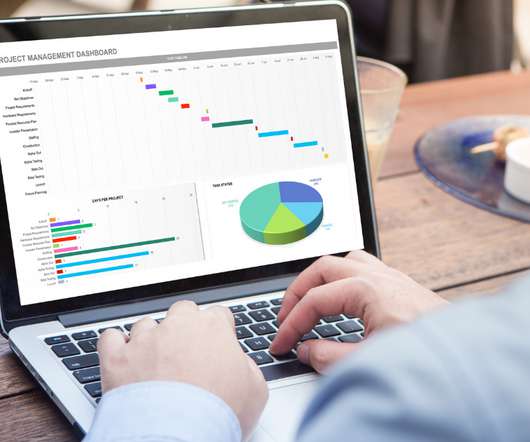
The Art of Insight , by Alberto Cairo, highlights how designers approach visualization with a wide view. In the narrowest view of datavisualization, you use charts to pull quick, quantitative information from dashboards and reports. Take a few steps back and you get exploratorydataanalysis and then storytelling.
Effective data handling, including preprocessing, exploratorydataanalysis, and making sure data quality, is crucial for creating reliable AI models. R: A powerful tool for statistical analysis and datavisualization, R is particularly useful for exploratorydataanalysis and research-focused AI applications.
Summary: ExploratoryDataAnalysis (EDA) uses visualizations to uncover patterns and trends in your data. Histograms, scatter plots, and charts reveal relationships and outliers, helping you understand your data and make informed decisions. Imagine a vast, uncharted territory – your data set.
Data scientists play a crucial role in today’s data-driven world, where extracting meaningful insights from vast amounts of information is key to organizational success. Their work blends statistical analysis, machine learning, and domain expertise to guide strategic decisions across various industries.
Making visualizations is one of the finest ways for data scientists to explain dataanalysis to people outside the business. Exploratorydataanalysis can help you comprehend your data better, which can aid in future data preprocessing. ExploratoryDataAnalysis What is EDA?
This is where a data workflow is essential, allowing you to turn your raw data into actionable insights. In this article, well explore how that workflow covering aspects from data collection to datavisualizations can tackle the real-world challenges. You may combine event data (e.g.,
The data sets are categorized according to varying difficulty levels to be suitable for everyone. Understanding fine-tuning, even if not doing it yourself, aids in informed decision-making. We need to communicate with other human beings to deliver information, express our emotions, present ideas, and much more.
Photo by Joshua Sortino on Unsplash Dataanalysis is an essential part of any research or business project. Before conducting any formal statistical analysis, it’s important to conduct exploratorydataanalysis (EDA) to better understand the data and identify any patterns or relationships.
While machine learning frameworks and platforms like PyTorch, TensorFlow, and scikit-learn can perform data exploration well, it’s not their primary intent. There are also plenty of datavisualization libraries available that can handle exploration like Plotly, matplotlib, D3, Apache ECharts, Bokeh, etc.
ExploratoryDataAnalysis on Stock Market Data Photo by Lukas Blazek on Unsplash ExploratoryDataAnalysis (EDA) is a crucial step in data science projects. It helps in understanding the underlying patterns and relationships in the data. quantile(0.25) q3 = df['Close'].quantile(0.75)
They employ statistical and mathematical techniques to uncover patterns, trends, and relationships within the data. Data scientists possess a deep understanding of statistical modeling, datavisualization, and exploratorydataanalysis to derive actionable insights and drive business decisions.
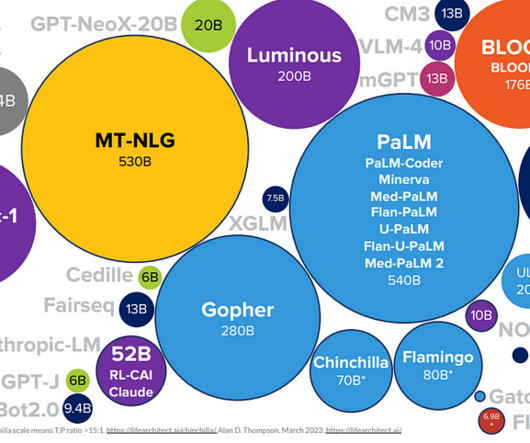
As we delve into 2023, the realms of Data Science, Artificial Intelligence (AI), and Large Language Models (LLMs) continue to evolve at an unprecedented pace. To keep up with these rapid developments, it’s crucial to stay informed through reliable and insightful sources.
Pipeline, as it sounds, consists of several activities and tools that are used to move data from one system to another using the same method of data processing and storage. Data pipelines automatically fetch information from various disparate sources for further consolidation and transformation into high-performing data storage.
Summary: DataAnalysis focuses on extracting meaningful insights from raw data using statistical and analytical methods, while datavisualization transforms these insights into visual formats like graphs and charts for better comprehension. But raw data, in its unprocessed state, is often just noise.
Principal component analysis (PCA) is a powerful technique that has transformed the way data scientists process and analyze information. Purpose of principal component analysis (PCA) Understanding the purpose behind PCA is crucial for its effective application in data processing.
Requirements Our solution is hosted on Deepnote , a collaborative data notebook that provides powerful features for data science projects. The dataset originated from Health Verity, one of the largest healthcare data ecosystems in the US. One important stage of any dataanalysis/science project is EDA.
Key Responsibilities of a Data Scientist in India While the core responsibilities align with global standards, Indian data scientists often face unique challenges and opportunities shaped by the local market: Data Acquisition and Cleaning: Extracting data from diverse sources including legacy systems, cloud platforms, and third-party APIs.
Today’s question is, “What does a data scientist do.” ” Step into the realm of data science, where numbers dance like fireflies and patterns emerge from the chaos of information. In this blog post, we’re embarking on a thrilling expedition to demystify the enigmatic role of data scientists.
Through each exercise, you’ll learn important data science skills as well as “best practices” for using pandas. By the end of the tutorial, you’ll be more fluent at using pandas to correctly and efficiently answer your own data science questions. Table of Contents: ExploratoryDataAnalysis is all about answering a specific question.
Recognizing the importance of HDB, in this blog we will delve deep to understand Singapore’s HDB resale prices based on a publicly available dataset using data-driven approaches. This dataset is intriguing due to its potential to build a regression model out of it, given its abundance of information from resale prices and related variables.
This empowers developers to make informed decisions, optimize their models, and improve the overall quality of their machine learning solutions. It provides a higher-level interface and enables the creation of informative and visually appealing statistical graphics. What are the best Python machine learning packages as of 2023?
By analyzing the sentiment of users towards certain products, services, or topics, sentiment analysis provides valuable insights that empower businesses and organizations to make informed decisions, gauge public opinion, and improve customer experiences.
These models, which are based on artificial intelligence and machine learning algorithms, are designed to process vast amounts of natural language data and generate new content based on that data. You should be comfortable working with data structures, algorithms, and libraries like NumPy, Pandas, and TensorFlow.
These figures underscore the significance of comprehending data methodologies for anyone navigating the digital landscape. Understanding Data Science Data Science involves analysing and interpreting complex data sets to uncover valuable insights that can inform decision-making and solve real-world problems.
For data scientist: An S3 bucket that Data Wrangler can use to output transformed data. For more information about prerequisites, see Get Started with Data Wrangler. The information and procedures in this section help you understand how to properly use the documentation provided by your IdP. Choose Next.
It accomplishes this by finding new features, called principal components, that capture the most significant patterns in the data. These principal components are ordered by importance, with the first component explaining the most variance in the data. Managing and analyzing such high-dimensional data can be challenging.
Afterwards, we will visualize the data we have obtained on the map using the Heatmap. After the visualization, he conducts an exploratorydataanalysis study about the concussions experienced, but briefly summarizing the severity of the experienced situations. Now our data has been turned into a dataframe.
Data science equips you with the tools and techniques to manage big data, perform exploratorydataanalysis, and extract meaningful information from complex datasets. Making data-driven decisions: Data science empowers you to make informed decisions by analyzing and interpreting data.
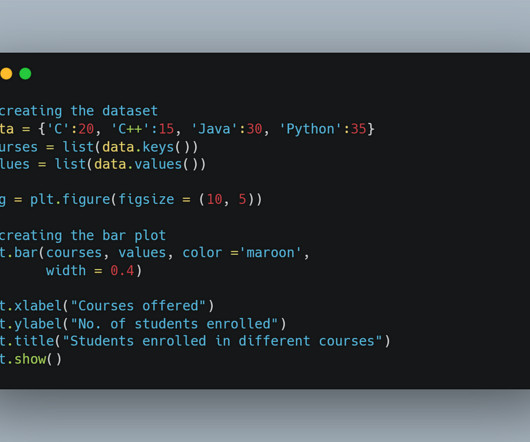
The simplicity of the code allows users to quickly visualise trends in their data without complicated syntax, making it a powerful tool for beginners and professionals alike. Seaborn Seaborn, a Python visualisation library built on Matplotlib, provides a high-level interface for creating attractive and informative statistical graphics.
Data scientists, on the other hand, extract valuable information from complex datasets to make data-driven decisions. At the core of Data Science lies the art of transforming raw data into actionable information that can guide strategic decisions. DataVisualization: Matplotlib, Seaborn, Tableau, etc.
Data storage : Store the data in a Snowflake data warehouse by creating a data pipe between AWS and Snowflake. Data Extraction, Preprocessing & EDA : Extract & Pre-process the data using Python and perform basic ExploratoryDataAnalysis. The data is in good shape.
Learn how Data Scientists use ChatGPT, a potent OpenAI language model, to improve their operations. ChatGPT is essential in the domains of natural language processing, modeling, dataanalysis, data cleaning, and datavisualization. It facilitates exploratoryDataAnalysis and provides quick insights.
A Introduction to HiPlot for DataAnalysis and Machine Learning Image by Author with @MidJourney Introduction Datavisualization is an essential tool for understanding complex datasets. Overall, this article aims to provide a comprehensive guide to using HiPlot for datavisualization and analysis.
Importance of Tableau Tableau is used by different industries and organisations that helps in collecting large amount of datasets and therefore, using the data to interpret meaningful information. It further helps in understanding the information better and utilise it for effective decision-making.
Objectives The challenge embraced several dataanalysis dimensions: from data cleaning and exploratorydataanalysis (EDA) to insightful datavisualization and predictive modeling.
The Art of Forecasting in the Retail Industry Part I : ExploratoryDataAnalysis & Time Series Analysis In this article, I will conduct exploratorydataanalysis and time series analysis using a dataset consisting of product sales in different categories from a store in the US between 2015 and 2018.
Plotly allows developers to embed interactive features such as zooming, panning, and hover effects directly into the plots, making it ideal for ExploratoryDataAnalysis and dynamic reports. Additionally, styles such as line thickness, marker size, and bar widths can be customised, giving your plots a distinct visual identity.
So, this will be counted as incorrect information. I will start by looking at the data distribution, followed by the relationship between the target variable and independent variables. replace(0,df[i].mean(),inplace=True)
We organize all of the trending information in your field so you don't have to. Join 17,000+ users and stay up to date on the latest articles your peers are reading.
You know about us, now we want to get to know you!
Let's personalize your content
Let's get even more personalized
We recognize your account from another site in our network, please click 'Send Email' below to continue with verifying your account and setting a password.


Let's personalize your content