Remove Data Visualization Remove Definition Remove EDA
article thumbnail

Data exploration

Dataconomy

Industries utilizing data exploration Data exploration is integral to numerous industries, where its applications can be transformative: Software development: In this field, data exploration is vital for analyzing performance metrics, enabling developers to optimize software applications.

article thumbnail

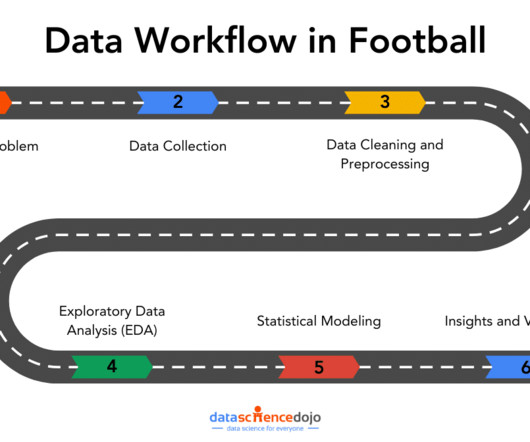
Data Workflows in Football Analytics: From Questions to Insights

Data Science Dojo

In this article, well explore how that workflow covering aspects from data collection to data visualizations can tackle the real-world challenges. Whether youre passionate about football or data, this journey highlights how smart analytics can increase performance.

Power BI 195
professionals

Sign Up for our Newsletter

This site is protected by reCAPTCHA and the Google Privacy Policy and Terms of Service apply.

article thumbnail

How to tackle lack of data: an overview on transfer learning

Data Science Blog

If you can analyze data with statistical knowledge or unsupervised machine learning, just extracting data without labeling would be enough. And sometimes ad hoc analysis with simple data visualization will help your decision makings. “Shut up and annotate!” ” could be often the best practice in practice.

article thumbnail

Understanding Data Science and Data Analysis Life Cycle

Pickl AI

Additionally, you will work closely with cross-functional teams, translating complex data insights into actionable recommendations that can significantly impact business strategies and drive overall success. Also Read: Explore data effortlessly with Python Libraries for (Partial) EDA: Unleashing the Power of Data Exploration.

article thumbnail

New projects contribute to digital commons

Hacker News

By addressing these important gaps in timing-aware design and incremental formal verification, the project aims to contribute important technological bricks to the open-source community, supporting the development of more capable and reliable open source EDA tools. Basic scripting commands compatible with Nutmeg will be provided.

EDA 69
article thumbnail

Build a Stocks Price Prediction App powered by Snowflake, AWS, Python and Streamlit?—?Part 2 of 3

Mlearning.ai

Data Extraction, Preprocessing & EDA & Machine Learning Model development Data collection : Automatically download the stock historical prices data in CSV format and save it to the AWS S3 bucket. Data storage : Store the data in a Snowflake data warehouse by creating a data pipe between AWS and Snowflake.

Python 52
article thumbnail

Multivariate Time Series Forecasting

Mlearning.ai

I used the Plotly library as a visualization tool to gain insights from my dataset. Plotly proved to be quite helpful in creating interactive graphs for visualizing the data. I recommend using this library for data visualization purposes. The residuals show the deviation levels around the data.