article thumbnail

Step-by-Step Exploratory Data Analysis (EDA) using Python

Analytics Vidhya

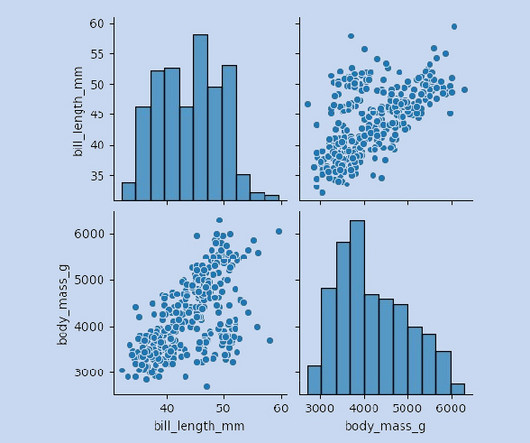
This article was published as a part of the Data Science Blogathon. Introduction to EDA The main objective of this article is to cover the steps involved in Data pre-processing, Feature Engineering, and different stages of Exploratory Data Analysis, which is an essential step in any research analysis.

article thumbnail

Three R Libraries for Automated EDA

Analytics Vidhya

These devices continuously collect and transmit data that can be processed, transformed, and stored for later use. This collected data, known as big data, holds valuable […]. The post Three R Libraries for Automated EDA appeared first on Analytics Vidhya.

EDA 384
professionals

Sign Up for our Newsletter

This site is protected by reCAPTCHA and the Google Privacy Policy and Terms of Service apply.

article thumbnail

Exploratory Data Analysis (EDA) in Python

Analytics Vidhya

Introduction Exploratory Data Analysis is a method of evaluating or comprehending data in order to derive insights or key characteristics. EDA can be divided into two categories: graphical analysis and non-graphical analysis. EDA is a critical component of any data science or machine learning process.

article thumbnail

Interactive Data Visualization Using Bqplot

Analytics Vidhya

Introduction Data visualization is crucial in Data Analytics. With exploratory data analysis (EDA), we gain insights into the hidden trends and patterns in a dataset that are useful for decision-making. The post Interactive Data Visualization Using Bqplot appeared first on Analytics Vidhya.

article thumbnail

Performing EDA of Netflix Dataset with Plotly

Analytics Vidhya

This article was published as a part of the Data Science Blogathon Image 1In this blog, We are going to talk about some of the advanced and most used charts in Plotly while doing analysis. All you need to know is Plotly for visualization! The post Performing EDA of Netflix Dataset with Plotly appeared first on Analytics Vidhya.

EDA 236
article thumbnail

Unveiling Financial Insights: A Financial EDA Journey

Analytics Vidhya

The post Unveiling Financial Insights: A Financial EDA Journey appeared first on Analytics Vidhya. He was a novice in the finance industry, and like many traders, he struggled to find a consistent and profitable trading strategy. Anand was determined to improve his skills and searched […].

EDA 280
article thumbnail

Netflix Case Study (EDA): Unveiling Data-Driven Strategies for Streaming

Analytics Vidhya

Netflix’s Global Reach Netflix […] The post Netflix Case Study (EDA): Unveiling Data-Driven Strategies for Streaming appeared first on Analytics Vidhya. With its vast library of movies and TV shows, it offers an abundance of choices for viewers around the world.

EDA 266