article thumbnail

Mastering Exploratory Data Analysis(EDA) For Data Science Enthusiasts

Analytics Vidhya

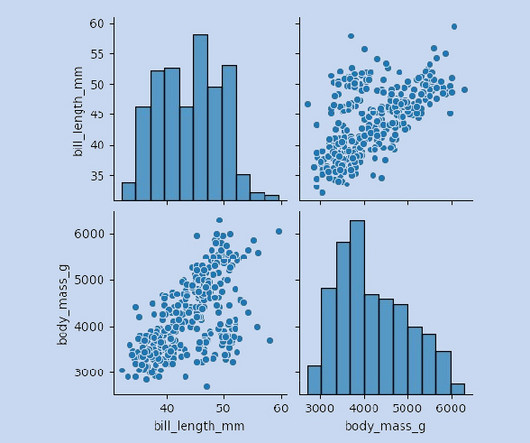
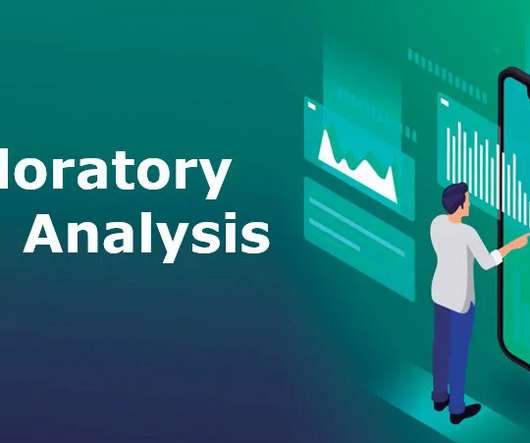
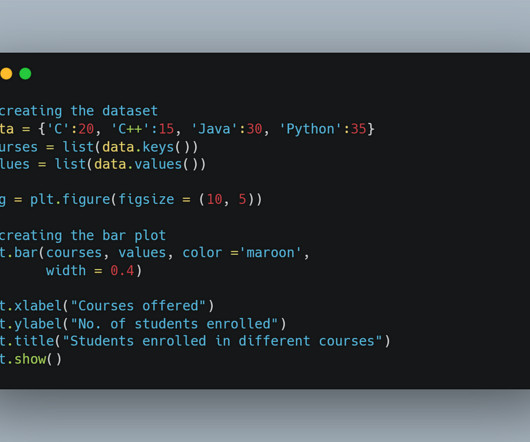
ArticleVideo Book This article was published as a part of the Data Science Blogathon. Overview Step by Step approach to Perform EDA Resources Like. The post Mastering Exploratory Data Analysis(EDA) For Data Science Enthusiasts appeared first on Analytics Vidhya.

article thumbnail

Three R Libraries for Automated EDA

Analytics Vidhya

This article was published as a part of the Data Science Blogathon. Introduction With the increasing use of technology, data accumulation is faster than ever due to connected smart devices. These devices continuously collect and transmit data that can be processed, transformed, and stored for later use.

EDA 399
professionals

Sign Up for our Newsletter

This site is protected by reCAPTCHA and the Google Privacy Policy and Terms of Service apply.

article thumbnail

Step-by-Step Exploratory Data Analysis (EDA) using Python

Analytics Vidhya

This article was published as a part of the Data Science Blogathon. Introduction to EDA The main objective of this article is to cover the steps involved in Data pre-processing, Feature Engineering, and different stages of Exploratory Data Analysis, which is an essential step in any research analysis.

article thumbnail

Exploratory Data Analysis (EDA) in Python

Analytics Vidhya

Introduction Exploratory Data Analysis is a method of evaluating or comprehending data in order to derive insights or key characteristics. EDA can be divided into two categories: graphical analysis and non-graphical analysis. EDA is a critical component of any data science or machine learning process.

article thumbnail

Interactive Data Visualization Using Bqplot

Analytics Vidhya

This article was published as a part of the Data Science Blogathon. Introduction Data visualization is crucial in Data Analytics. With exploratory data analysis (EDA), we gain insights into the hidden trends and patterns in a dataset that are useful for decision-making. are […]. are […].

article thumbnail

KDnuggets News 22:n16, Apr 20: Top YouTube Channels for Learning Data Science; Data Visualization in Python with Seaborn

KDnuggets

Top YouTube Channels for Learning Data Science; Data Visualization in Python with Seaborn; Deploy a Machine Learning Web App with Heroku; How to Ace Data Science Assessment Test by Using Automatic EDA Tools; Will DeepMind’s AlphaCode Replace Programmers?

article thumbnail

Performing EDA of Netflix Dataset with Plotly

Analytics Vidhya

This article was published as a part of the Data Science Blogathon Image 1In this blog, We are going to talk about some of the advanced and most used charts in Plotly while doing analysis. All you need to know is Plotly for visualization!

EDA 275