This site uses cookies to improve your experience. To help us insure we adhere to various privacy regulations, please select your country/region of residence. If you do not select a country, we will assume you are from the United States. Select your Cookie Settings or view our Privacy Policy and Terms of Use.
Cookie Settings
Cookies and similar technologies are used on this website for proper function of the website, for tracking performance analytics and for marketing purposes. We and some of our third-party providers may use cookie data for various purposes. Please review the cookie settings below and choose your preference.
Used for the proper function of the website
Used for monitoring website traffic and interactions
Cookie Settings
Cookies and similar technologies are used on this website for proper function of the website, for tracking performance analytics and for marketing purposes. We and some of our third-party providers may use cookie data for various purposes. Please review the cookie settings below and choose your preference.
Strictly Necessary: Used for the proper function of the website
Performance/Analytics: Used for monitoring website traffic and interactions
Introduction What kind of database did you use to build your most recent application? According to Scalegrid’s 2019 database trends report, SQL is the most popular database form, with more than 60% of its use. It is followed by NoSQL databases with more than 39% use.
Analytics databases play a crucial role in driving insights and decision-making in today’s data-driven world. By providing a structured way to analyze historical data, these databases empower organizations to uncover trends and patterns that inform strategies and optimize operations. What are analytics databases?
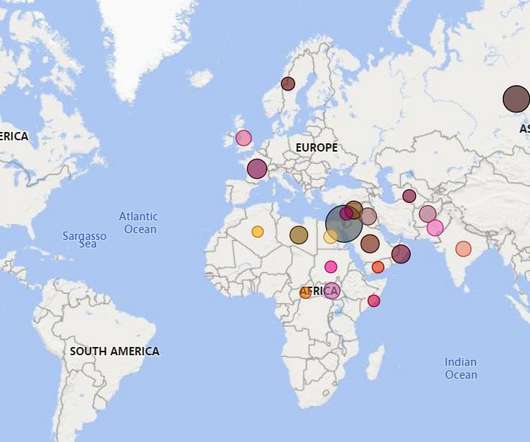
ArticleVideo Book This article was published as a part of the Data Science Blogathon. The post Learn how to get insights from Azure SQLDatabase: A sample data analytics project using Global Peace Index data appeared first on Analytics Vidhya.
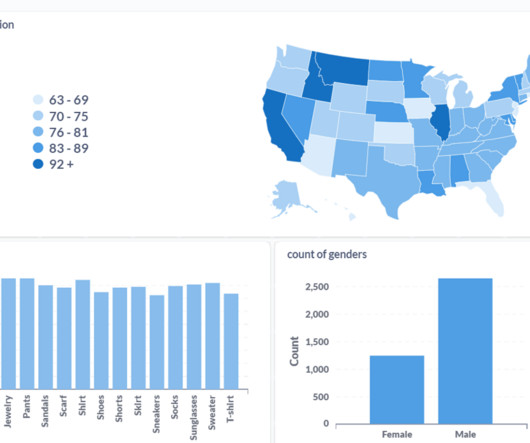
In today’s data-driven world, BI platforms like Metabase are essential for extracting insights and facilitating informed decision-making. Discover the power of Metabase in this guide tailored for data professionals.
Introduction Most of us are familiar with SQL, and many of us have hands-on experience with it. The post BigQuery: An Walkthrough of ML with Conventional SQL appeared first on Analytics Vidhya. Machine learning is an increasingly popular and developing trend among us.
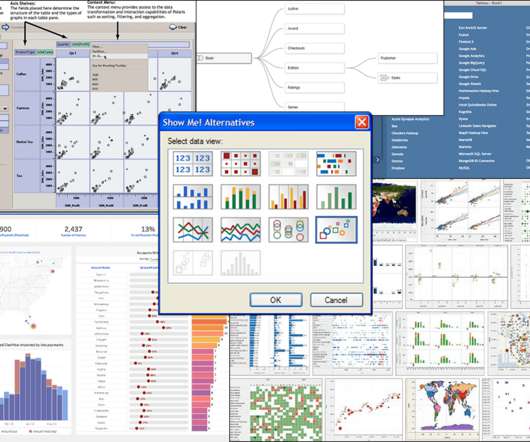
This article was published as a part of the Data Science Blogathon. Introduction Tableau is a datavisualization tool created in Salesforce that allows users to connect to any database, like SQL or MongoDB, and interact freely.
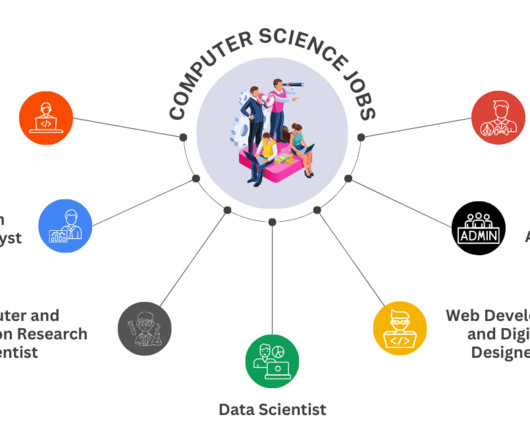
Top Employers Microsoft, Facebook, and consulting firms like Accenture are actively hiring in this field of remote data science jobs, with salaries generally ranging from $95,000 to $140,000. Their role is crucial in understanding the underlying data structures and how to leverage them for insights.
Data Analyst Data analysts are responsible for collecting, analyzing, and interpreting large sets of data to identify patterns and trends. They require strong analytical skills, knowledge of statistical analysis, and expertise in datavisualization.
Pandas Pandas is a powerful data manipulation library for Python that provides fast, flexible, and expressive data structures designed to make working with “relational” or “labeled” data easy and intuitive.
Azure Data Studio has rapidly gained popularity among developers and database administrators for its user-friendly design and powerful features. As a versatile tool, it simplifies the management of both SQL Server and Azure SQLdatabases, offering a modern alternative to traditional database management solutions.
Key Skills Required Knowledge of Algorithms and Predictive Models: Proficiency in using algorithms and predictive models to forecast future trends based on present data. DataVisualization Techniques: Ability to transform complex data into understandable graphs and charts.
SQL is one of the key languages widely used across businesses, and it requires an understanding of databases and table metadata. This can be overwhelming for nontechnical users who lack proficiency in SQL. This application allows users to ask questions in natural language and then generates a SQL query for the users request.
Data is an essential component of any business, and it is the role of a data analyst to make sense of it all. Power BI is a powerful datavisualization tool that helps them turn raw data into meaningful insights and actionable decisions. Learn Power BI with this crash course in no time!
These skills include programming languages such as Python and R, statistics and probability, machine learning, datavisualization, and data modeling. Data preparation is an essential step in the data science workflow, and data scientists should be familiar with various data preparation tools and best practices.
Though both are great to learn, what gets left out of the conversation is a simple yet powerful programming language that everyone in the data science world can agree on, SQL. But why is SQL, or Structured Query Language , so important to learn? Let’s start with the first clause often learned by new SQL users, the WHERE clause.
Data Storytelling in Action: This panel will discuss the importance of datavisualization in storytelling in different industries, different visualization tools, tips on improving one’s visualization skills, personal experiences, breakthroughs, pressures, and frustrations as well as successes and failures.
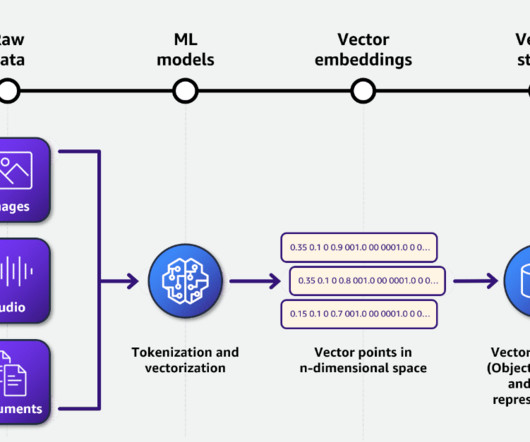
Data Sources and Collection Everything in data science begins with data. Data can be generated from databases, sensors, social media platforms, APIs, logs, and web scraping. Data can be in structured (like tables in databases), semi-structured (like XML or JSON), or unstructured (like text, audio, and images) form.
Data science bootcamps are intensive short-term educational programs designed to equip individuals with the skills needed to enter or advance in the field of data science. They cover a wide range of topics, ranging from Python, R, and statistics to machine learning and datavisualization.
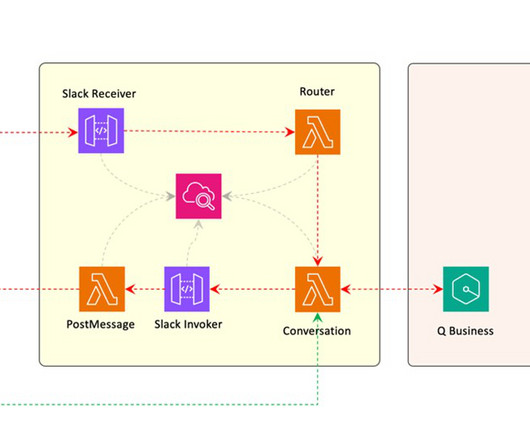
By moving our core infrastructure to Amazon Q, we no longer needed to choose a large language model (LLM) and optimize our use of it, manage Amazon Bedrock agents, a vector database and semantic search implementation, or custom pipelines for data ingestion and management. Jonathan Garcia is a Sr.
There are many well-known libraries and platforms for data analysis such as Pandas and Tableau, in addition to analytical databases like ClickHouse, MariaDB, Apache Druid, Apache Pinot, Google BigQuery, Amazon RedShift, etc. Datavisualization can help here by visualizing your datasets.
Datavisualization tools turn insights and data into something understandable, especially for non-data stakeholders who may not share the same skillsets as the team who’s behind the data. So let’s take a look at seven trending datavisualization tools that have gotten quite a bit of attention on GitHub this year.
You might be asking, “How to become a data scientist with a background in a different field?” ” Data management and manipulation Data scientists often deal with vast amounts of data, so it’s crucial to understand databases, data architecture, and query languages like SQL.
There’s not much value in holding on to raw data without putting it to good use, yet as the cost of storage continues to decrease, organizations find it useful to collect raw data for additional processing. The raw data can be fed into a database or data warehouse. If it’s not done right away, then later.
Below are the essential core skills that aspiring and practicing data scientists need to excel in India’s competitive job market: Programming Languages: Proficiency in Python and R is essential. SQL remains crucial for database querying, especially given India’s large IT services ecosystem. Big Data: Apache Hadoop, Apache Spark.
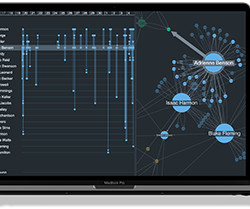
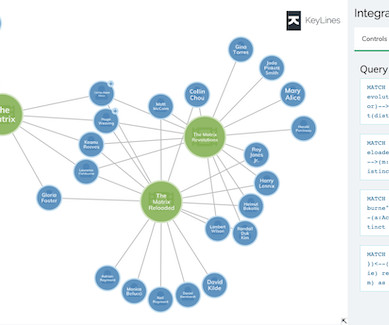
Visualizing graph data doesn’t necessarily depend on a graph database… Working on a graph visualization project? You might assume that graph databases are the way to go – they have the word “graph” in them, after all. Do I need a graph database? It depends on your project. Unstructured?
That’s why our datavisualization SDKs are database agnostic: so you’re free to choose the right stack for your application. There have been a lot of new entrants and innovations in the graph database category, with some vendors slowly dipping below the radar, or always staying on the periphery.
Summary: Data Analysis focuses on extracting meaningful insights from raw data using statistical and analytical methods, while datavisualization transforms these insights into visual formats like graphs and charts for better comprehension. Deep Dive: What is DataVisualization?
Summary: Master SQL ranking functions to analyze data order and uncover trends. Introduction to SQL Ranking In the realm of Data Analysis, extracting insights often goes beyond simple aggregations. Introduction to SQL Ranking In the realm of Data Analysis, extracting insights often goes beyond simple aggregations.
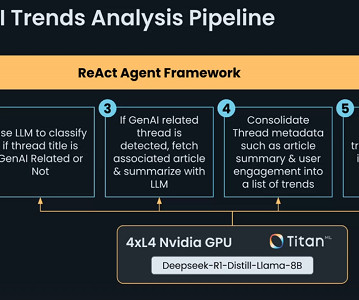
Chart and datavisualization interpretation The model demonstrates exceptional proficiency in understanding complex visualdata representations. It can effortlessly identify trends, anomalies, and key data points within graphical visualizations. You have created an ER diagram.
They would source large volumes of data from different platforms into Hadoop’s. NoSQL and SQL. In addressing storage needs, traditional databases like Oracle are being replaced. Developers need an understanding of MongoDB, Couchbase, and other NoSQL database types. Apache Spark. Quantitative Analysis.
Summary: Data engineering tools streamline data collection, storage, and processing. Tools like Python, SQL, Apache Spark, and Snowflake help engineers automate workflows and improve efficiency. Learning these tools is crucial for building scalable data pipelines. What Does a Data Engineer Do?
Datavisualization For a long time, Tableau led the industry in datavisualization. Those conclusions can then be compared against the existing in-house analytics and serve as a nice way to double-check that the business is looking at its data in the right way. Documenting with ChatPRD 9.
Unified data storage : Fabric’s centralized data lake, Microsoft OneLake, eliminates data silos and provides a unified storage system, simplifying data access and retrieval. OneLake is designed to store a single copy of data in a unified location, leveraging the open-source Apache Parquet format.
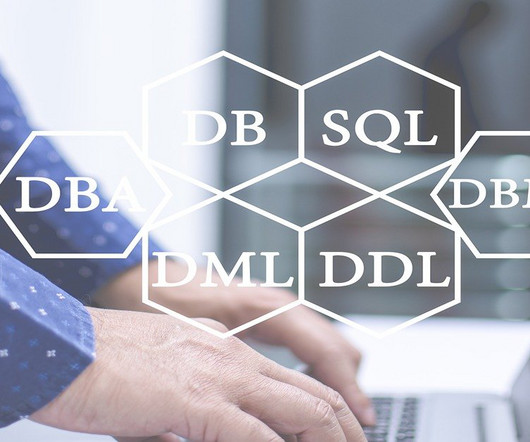
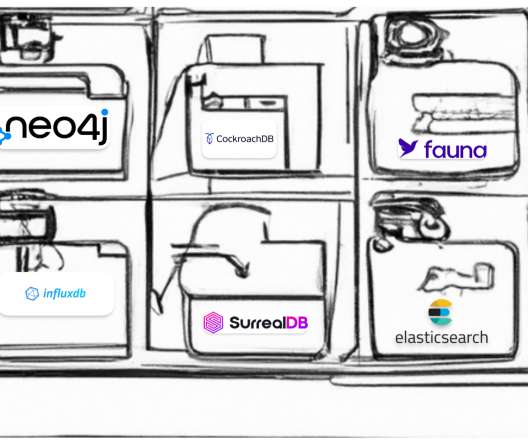
Welcome to the wild, wacky world of databases! to the digital world, you’ll find that these unsung heroes of the digital age are essential for keeping your data organised and secure. But with so many types of databases to choose from, how do you know which one is right for you? The most well-known graph database is Neo4j.
Chris had earned an undergraduate computer science degree from Simon Fraser University and had worked as a database-oriented software engineer. In 2004, Tableau got both an initial series A of venture funding and Tableau’s first EOM contract with the database company Hyperion—that’s when I was hired. Release v1.0
Build a Data Analyst AI Agent fromScratch Daniel Herrera, Principal Developer Advocate atTeradata Daniel Herrera guided attendees through the process of building a data analyst AI agent from the ground up. He covered schema design, vector indexing, and ranking functions to optimize AI-driven search and recommendation systems.
Summary: Business Intelligence Analysts transform raw data into actionable insights. They use tools and techniques to analyse data, create reports, and support strategic decisions. Key skills include SQL, datavisualization, and business acumen. Introduction We are living in an era defined by data.
It can connect any data source, although the better your source, the better the results will be. Another key benefit is that it allows companies to create datavisualizations! Another cloud-based software with an easy-to-use interface, Looker provides not only data analytics and management, but also business intelligence tools.
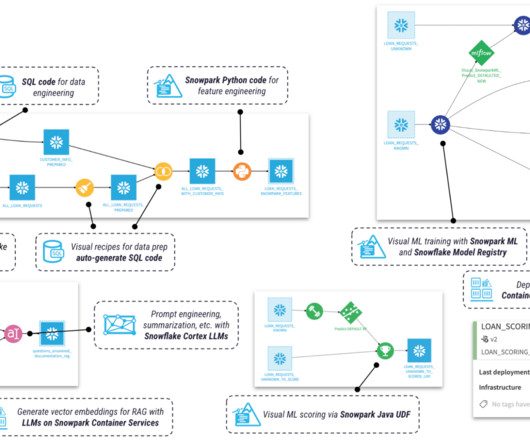
By providing a single, unified platform for data storage, management, and analysis, Snowflake connects organizations to leading software vendors specializing in analytics, machine learning, datavisualization, and more.
It is the process of converting raw data into relevant and practical knowledge to help evaluate the performance of businesses, discover trends, and make well-informed choices. Data gathering, data integration, data modelling, analysis of information, and datavisualization are all part of intelligence for businesses.
This article was published as a part of the Data Science Blogathon. Source: Author(Paint) Introduction Arushi is a data architect in a company named Redeem. The company provides cashback to customers who check in at restaurants & hotels.
It is popular for its powerful datavisualization and analysis capabilities. Hence, Data Scientists rely on R to perform complex statistical operations. With a wide array of packages like ggplot2 and dplyr, R allows for sophisticated datavisualization and efficient data manipulation. Wrapping it up !!!
With Looker’s secure, trusted and highly performant data governance capabilities, we can augment Tableau’s world-class datavisualization capabilities to enable data-driven decisions across the enterprise. Tableau Prep allows you to combine, reshape, and clean data using an easy-to-use, visual, and direct interface.
Common databases appear unable to cope with the immense increase in data volumes. This is where the BigQuery data warehouse comes into play. BigQuery operation principles Business intelligence projects presume collecting information from different sources into one database. BigQuery for Marketing: What Makes it Special?
We organize all of the trending information in your field so you don't have to. Join 17,000+ users and stay up to date on the latest articles your peers are reading.
You know about us, now we want to get to know you!
Let's personalize your content
Let's get even more personalized
We recognize your account from another site in our network, please click 'Send Email' below to continue with verifying your account and setting a password.


Let's personalize your content