Remove Data Models Remove Data Visualization Remove Events
article thumbnail

Data Mesh Architecture on Cloud for BI, Data Science and Process Mining

Data Science Blog

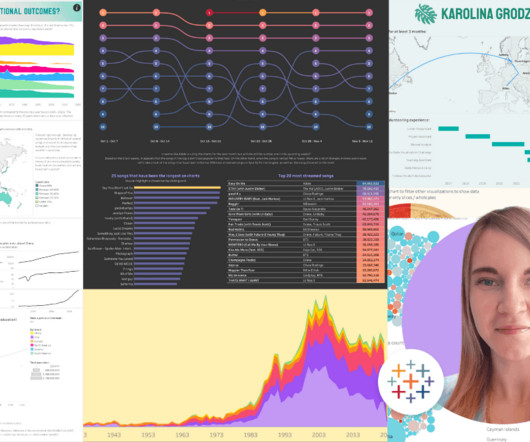
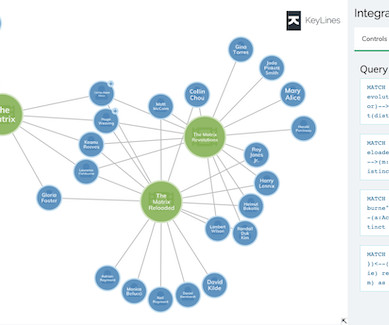
A Data Product can take various forms, depending on the domain’s requirements and the data it manages. It could be a curated dataset, a machine learning model, an API that exposes data, a real-time data stream, a data visualization dashboard, or any other data-related asset that provides value to the organization.

article thumbnail

Remote Data Science Jobs: 5 High-Demand Roles for Career Growth

Data Science Dojo

Their role is crucial in understanding the underlying data structures and how to leverage them for insights. Key Skills Proficiency in SQL is essential, along with experience in data visualization tools such as Tableau or Power BI.

professionals

Sign Up for our Newsletter

This site is protected by reCAPTCHA and the Google Privacy Policy and Terms of Service apply.

article thumbnail

Mastering the Art of Data Visualization: Tips & Techniques

ODSC - Open Data Science

In the digital era, data visualization stands as an indispensable tool in the realm of business intelligence. It represents the graphical display of data and information, transforming complex datasets into intuitive and understandable visuals.

article thumbnail

Beyond data: Cloud analytics mastery for business brilliance

Dataconomy

Key features of cloud analytics solutions include: Data models , Processing applications, and Analytics models. Data models help visualize and organize data, processing applications handle large datasets efficiently, and analytics models aid in understanding complex data sets, laying the foundation for business intelligence.

Analytics 203
article thumbnail

Student to BI Analyst, How Tableau Can Lead to a Successful Data Career

Tableau

Countless hours vizzing, a standout Tableau Public profile , and a graduate degree later, Karolina reflects on her data journey and what led her to her current role as a Business Intelligence Analyst at Schneider Electric. I already had some interest in data visualization, I just didn't know where to start.

Tableau 131
article thumbnail

How to build a simple data visualization web app with Neo4j

Cambridge Intelligence

In this tutorial for JavaScript developers, I’ll demonstrate how to integrate our graph visualization SDKs with Neo4j to create a powerful data visualization web app. Once they’re embedded into your web app, you can customize each interaction and every node, edge, event and property to create the exact look and feel you want.

article thumbnail

How Light & Wonder built a predictive maintenance solution for gaming machines on AWS

AWS Machine Learning Blog

Working with AWS, Light & Wonder recently developed an industry-first secure solution, Light & Wonder Connect (LnW Connect), to stream telemetry and machine health data from roughly half a million electronic gaming machines distributed across its casino customer base globally when LnW Connect reaches its full potential.

AWS 118