This site uses cookies to improve your experience. To help us insure we adhere to various privacy regulations, please select your country/region of residence. If you do not select a country, we will assume you are from the United States. Select your Cookie Settings or view our Privacy Policy and Terms of Use.
Cookie Settings
Cookies and similar technologies are used on this website for proper function of the website, for tracking performance analytics and for marketing purposes. We and some of our third-party providers may use cookie data for various purposes. Please review the cookie settings below and choose your preference.
Used for the proper function of the website
Used for monitoring website traffic and interactions
Cookie Settings
Cookies and similar technologies are used on this website for proper function of the website, for tracking performance analytics and for marketing purposes. We and some of our third-party providers may use cookie data for various purposes. Please review the cookie settings below and choose your preference.
Strictly Necessary: Used for the proper function of the website
Performance/Analytics: Used for monitoring website traffic and interactions
In retail, complete and consistent data is necessary to understand customer behavior and optimize sales strategies. Without data fidelity, decision-makers cannot rely on data insights to make informed decisions. Poor dataquality can result in wasted resources, inaccurate conclusions, and lost opportunities.
It advocates decentralizing data ownership to domain-oriented teams. Each team becomes responsible for its Data Products , and a self-serve data infrastructure is established. This enables scalability, agility, and improved dataquality while promoting data democratization.
Key features of augmented analytics A variety of features distinguish augmented analytics from traditional data analytics models. Smart data preparation Automated data cleaning is a crucial part of augmented analytics. It involves processes that improve dataquality, such as removing duplicates and addressing inconsistencies.
These tools provide data engineers with the necessary capabilities to efficiently extract, transform, and load (ETL) data, build data pipelines, and prepare data for analysis and consumption by other applications. Essential data engineering tools for 2023 Top 10 data engineering tools to watch out for in 2023 1.
In retail, complete and consistent data is necessary to understand customer behavior and optimize sales strategies. Without data fidelity, decision-makers cannot rely on data insights to make informed decisions. Poor dataquality can result in wasted resources, inaccurate conclusions, and lost opportunities.
To help you identify and resolve these mistakes, we’ve put together this guide on the various big data mistakes that marketers tend to make. Big Data Mistakes You Must Avoid. Here are some common big data mistakes you must avoid to ensure that your campaigns aren’t affected. Ignoring DataQuality. What’s more?
Despite that understanding, many organizations lack a clear framework for organizing, managing, and governing their valuable data assets. In many cases, that realization prompts executive leaders to create a datagovernance program within their company. In many organizations, that simply isn’t the case.
To democratize data, organizations need to provide people with the tools and resources they need to access, analyze, and draw insights from data. The ultimate goal of data democratization is to create a more open and transparent culture around data, where everyone has access to the information they need to make informed decisions.
Here are some of the key types of cloud analytics: Descriptive analytics: This type focuses on summarizing historical data to provide insights into what has happened in the past. It helps organizations understand trends, patterns, and anomalies in their data.
This could include dataquality checks, alerts, and notifications. Establish datagovernance: Establish clear datagovernance policies to ensure that your data is accurate, complete, and accessible. This could include datavisualization tools, predictive analytics software, and more.
Are you an aspiring data scientist , or just want to understand the benefits of integrating data catalogs with visualization tools? In today’s ever-growing world of data, having an easy way to gain insights quickly is essential. It helps them effectively capture, store, manage, and share data assets.
Link to event -> Generative AI and Data Storytelling Here are some of the key takeaways from the article: Generative AI is a type of artificial intelligence that can create new content, such as text, images, and music. Data storytelling is the process of using data to communicate a story in a way that is engaging and informative.
Are you an aspiring data scientist , or just want to understand the benefits of integrating data catalogs with visualization tools? In today’s ever-growing world of data, having an easy way to gain insights quickly is essential. It helps them effectively capture, store, manage, and share data assets.
Entity resolution Entity resolution techniques consolidate data points into comprehensive profiles, allowing organizations to understand and act on the complete picture of their data. Data enrichment and AI processing Enhancing dataquality is crucial in this phase.
To democratize data, organizations need to provide people with the tools and resources they need to access, analyze, and draw insights from data. The ultimate goal of data democratization is to create a more open and transparent culture around data, where everyone has access to the information they need to make informed decisions.
Data Observability and DataQuality are two key aspects of data management. The focus of this blog is going to be on Data Observability tools and their key framework. The growing landscape of technology has motivated organizations to adopt newer ways to harness the power of data. What is Data Observability?
An enterprise data catalog does all that a library inventory system does – namely streamlining data discovery and access across data sources – and a lot more. For example, data catalogs have evolved to deliver governance capabilities like managing dataquality and data privacy and compliance.
Address common challenges in managing SAP master data by using AI tools to automate SAP processes and ensure dataquality. Create an AI-driven data and process improvement loop to continuously enhance your business operations. Think about material master data, for example. Data creation and management processes.
Data Pipeline Use Cases Here are just a few examples of the goals you can achieve with a robust data pipeline: Data Prep for VisualizationData pipelines can facilitate easier datavisualization by gathering and transforming the necessary data into a usable state.
An ACE is a dedicated team or unit within an organization that is responsible for managing and optimizing the use of data and analytics. Step 5: Establish Processes and Policies for Data Management and Analysis An ACE should establish clear processes and policies for managing and analyzing data.
Part 1 of this article considered the key takeaways in datagovernance, discussed at Enterprise Data World 2024. […] The post Enterprise Data World 2024 Takeaways: Key Trends in Applying AI to Data Management appeared first on DATAVERSITY.
Multiple data applications and formats make it harder for organizations to access, govern, manage and use all their data for AI effectively. Scaling data and AI with technology, people and processes Enabling data as a differentiator for AI requires a balance of technology, people and processes.
Proficient in programming languages like Python or R, data manipulation libraries like Pandas, and machine learning frameworks like TensorFlow and Scikit-learn, data scientists uncover patterns and trends through statistical analysis and datavisualization. DataVisualization: Matplotlib, Seaborn, Tableau, etc.
From powerful analytics software to Machine Learning algorithms, these tools transform data into actionable intelligence. Exploring technologies like Datavisualization tools and predictive modeling becomes our compass in this intricate landscape. It ensures dataquality , integrity, and compliance.
Data Pipeline Use Cases Here are just a few examples of the goals you can achieve with a robust data pipeline: Data Prep for VisualizationData pipelines can facilitate easier datavisualization by gathering and transforming the necessary data into a usable state.
Clearly defining your objectives will guide critical decisions regarding data selection, modelling approaches, and reporting strategies. Ensure DataQualityDataquality is the cornerstone of a successful data warehouse. Regularly Monitor and Maintain A data warehouse is not a static entity.
These programs allow them to design and build scalable and efficient data pimples that can handle large volumes of data, and ensure that the data is stored in a secure and reliable manner. DataGovernance Manager Believe it or not, data requires rules to stay consistent, accurate, and secure.
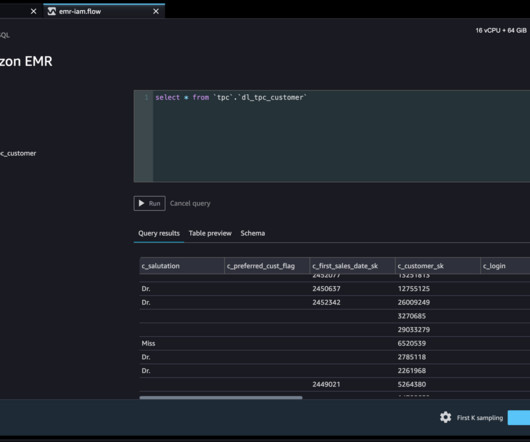
Our customers wanted the ability to connect to Amazon EMR to run ad hoc SQL queries on Hive or Presto to query data in the internal metastore or external metastore (such as the AWS Glue Data Catalog ), and prepare data within a few clicks. Alternatively, on the File menu, choose New , then choose Data Wrangler flow.
Running a business is impossible without data. Data clarifies the facts, revealing insights that help everyone from top executives to front-line employees make better decisions. Nonetheless, it is as much an art as a science to make sense of data and use it to maximum effect. The amount of data […].
Data Cleaning and Transformation Techniques for preprocessing data to ensure quality and consistency, including handling missing values, outliers, and data type conversions. Students should learn about data wrangling and the importance of dataquality.
This comprehensive blog outlines vital aspects of Data Analyst interviews, offering insights into technical, behavioural, and industry-specific questions. It covers essential topics such as SQL queries, datavisualization, statistical analysis, machine learning concepts, and data manipulation techniques.
Insights are immediately generated by entering a data question into ThoughtSpot’s Ask any data question search bar. DataVisualizations ThoughSpot enables users to easily pin data answers and insights to a Liveboard, the ThoughtSpot term for a dashboard.
Summary: Struggling to translate data into clear stories? This datavisualization tool empowers Data Analysts with drag-and-drop simplicity, interactive dashboards, and a wide range of visualizations. Tableau can help!
Better Transparency: There’s more clarity about where data is coming from, where it’s going, why it’s being transformed, and how it’s being used. Improved DataGovernance: This level of transparency can also enhance datagovernance and control mechanisms in the new data system.
See how phData created a solution for ingesting and interpreting HL7 data 4. DataQuality Inaccurate data can have negative impacts on patient interactions or loss of productivity for the business. Sigma and Snowflake offer data profiling to identify inconsistencies, errors, and duplicates.
Humans process visualdata far more quickly and effectively than other ways of presenting information. The need for visualdata, which speaks for thousands of words, has sparked the emergence of interactive dashboards. Click to learn more about author Ashok Sharma.
Considerations for a modern IT environment To harness the full potential of continuous intelligence, organizations need to eliminate data silos that hinder data sharing and collaboration. Maintaining robust datagovernance is also vital, ensuring that dataquality and compliance standards are upheld throughout the organization.
En la actualidad, los modelos analíticos son herramientas esenciales para tomar decisiones basadas en datos. Desde prever tendencias hasta optimizar operaciones, los modelos analíticos dependen en gran medida de la calidad de los datos de entrada.
We organize all of the trending information in your field so you don't have to. Join 17,000+ users and stay up to date on the latest articles your peers are reading.
You know about us, now we want to get to know you!
Let's personalize your content
Let's get even more personalized
We recognize your account from another site in our network, please click 'Send Email' below to continue with verifying your account and setting a password.


Let's personalize your content