This site uses cookies to improve your experience. To help us insure we adhere to various privacy regulations, please select your country/region of residence. If you do not select a country, we will assume you are from the United States. Select your Cookie Settings or view our Privacy Policy and Terms of Use.
Cookie Settings
Cookies and similar technologies are used on this website for proper function of the website, for tracking performance analytics and for marketing purposes. We and some of our third-party providers may use cookie data for various purposes. Please review the cookie settings below and choose your preference.
Used for the proper function of the website
Used for monitoring website traffic and interactions
Cookie Settings
Cookies and similar technologies are used on this website for proper function of the website, for tracking performance analytics and for marketing purposes. We and some of our third-party providers may use cookie data for various purposes. Please review the cookie settings below and choose your preference.
Strictly Necessary: Used for the proper function of the website
Performance/Analytics: Used for monitoring website traffic and interactions
A Data Product can take various forms, depending on the domain’s requirements and the data it manages. It could be a curated dataset, a machine learning model, an API that exposes data, a real-time data stream, a datavisualization dashboard, or any other data-related asset that provides value to the organization.
Their role is crucial in understanding the underlying data structures and how to leverage them for insights. Key Skills Proficiency in SQL is essential, along with experience in datavisualization tools such as Tableau or Power BI.
Data engineering tools offer a range of features and functionalities, including data integration, data transformation, data quality management, workflow orchestration, and datavisualization. Essential data engineering tools for 2023 Top 10 data engineering tools to watch out for in 2023 1.
Key features of cloud analytics solutions include: Datamodels , Processing applications, and Analytics models. Datamodels help visualize and organize data, processing applications handle large datasets efficiently, and analytics models aid in understanding complex data sets, laying the foundation for business intelligence.
Leveraging Looker’s semantic layer will provide Tableau customers with trusted, governeddata at every stage of their analytics journey. With its LookML modeling language, Looker provides a unique, modern approach to define governed and reusable datamodels to build a trusted foundation for analytics.
Summary: This blog dives into the most promising Power BI projects, exploring advanced datavisualization, AI integration, IoT & blockchain analytics, and emerging technologies. Discover best practices for successful implementation and propel your organization towards data-driven success.
It is the process of converting raw data into relevant and practical knowledge to help evaluate the performance of businesses, discover trends, and make well-informed choices. Data gathering, data integration, datamodelling, analysis of information, and datavisualization are all part of intelligence for businesses.
It integrates seamlessly with a wide range of data sources like Excel, Azure and SQL server, Salesforce, SAP Hana, IBM Netezza and CDP which makes it a compelling choice for businesses that have already invested in the Microsoft ecosystem. It allows users to create highly customizable and visually appealing reports.
Leveraging Looker’s semantic layer will provide Tableau customers with trusted, governeddata at every stage of their analytics journey. With its LookML modeling language, Looker provides a unique, modern approach to define governed and reusable datamodels to build a trusted foundation for analytics.
Proficient in programming languages like Python or R, data manipulation libraries like Pandas, and machine learning frameworks like TensorFlow and Scikit-learn, data scientists uncover patterns and trends through statistical analysis and datavisualization. DataVisualization: Matplotlib, Seaborn, Tableau, etc.
Inaccurate or inconsistent data leads to misleading insights and, ultimately, poor decision-making. Implement robust datagovernance processes to ensure data accuracy and consistency throughout the ETL process. Embrace a well-structured datamodel that aligns with your business needs.
These programs allow them to design and build scalable and efficient data pimples that can handle large volumes of data, and ensure that the data is stored in a secure and reliable manner. As you can imagine, data architects require a strong background in database design, datamodeling, and data management.
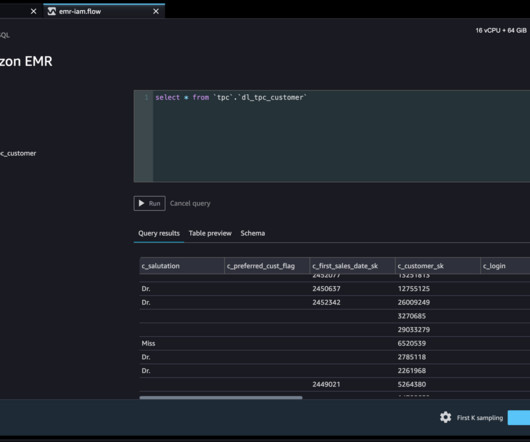
Our customers wanted the ability to connect to Amazon EMR to run ad hoc SQL queries on Hive or Presto to query data in the internal metastore or external metastore (such as the AWS Glue Data Catalog ), and prepare data within a few clicks. Alternatively, on the File menu, choose New , then choose Data Wrangler flow.
From powerful analytics software to Machine Learning algorithms, these tools transform data into actionable intelligence. Exploring technologies like Datavisualization tools and predictive modeling becomes our compass in this intricate landscape. It ensures data quality , integrity, and compliance.
Summary: Struggling to translate data into clear stories? This datavisualization tool empowers Data Analysts with drag-and-drop simplicity, interactive dashboards, and a wide range of visualizations. Tableau can help!
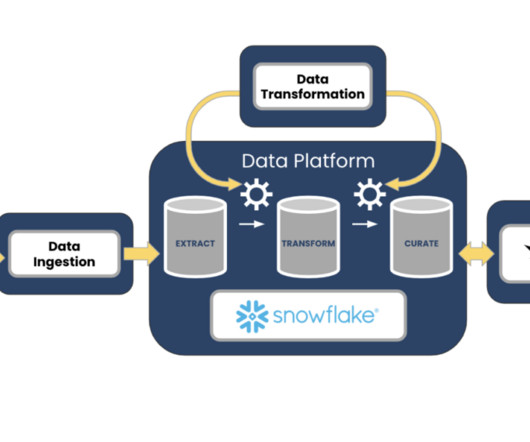
Enter dbt dbt provides SQL-centric transformations for your datamodeling and transformations, which is efficient for scrubbing and transforming your data while being an easy skill set to hire for and develop within your teams. However, merely knowing what it consists of isn’t enough.
Sigma and Snowflake offer data profiling to identify inconsistencies, errors, and duplicates. Data validation rules can be implemented to check for missing or invalid values, and datagovernance features like data lineage tracking, reusable data definitions, and access controls ensure that data is managed in a compliant and secure manner.
Explainable AI refers to ways of ensuring that the results and outputs of artificial intelligence (AI) can be understood by humans. It contrasts with the concept of the “black box” AI, which produces answers with no explanation or understanding of how it arrived at them.
A dataset is a reusable datamodel that empowers users to create reports, dashboards, and analyses without directly accessing the underlying database. Its functionality comprises standing as an intermediary between raw data and visualizations and, thereby, acts as the place to facilitate ease of data exploration and analysis.
Data often arrives from multiple sources in inconsistent forms, including duplicate entries from CRM systems, incomplete spreadsheet records, and mismatched naming conventions across databases. These issues slow analysis pipelines and demand time-consuming cleanup.
We organize all of the trending information in your field so you don't have to. Join 17,000+ users and stay up to date on the latest articles your peers are reading.
You know about us, now we want to get to know you!
Let's personalize your content
Let's get even more personalized
We recognize your account from another site in our network, please click 'Send Email' below to continue with verifying your account and setting a password.


Let's personalize your content