This site uses cookies to improve your experience. To help us insure we adhere to various privacy regulations, please select your country/region of residence. If you do not select a country, we will assume you are from the United States. Select your Cookie Settings or view our Privacy Policy and Terms of Use.
Cookie Settings
Cookies and similar technologies are used on this website for proper function of the website, for tracking performance analytics and for marketing purposes. We and some of our third-party providers may use cookie data for various purposes. Please review the cookie settings below and choose your preference.
Used for the proper function of the website
Used for monitoring website traffic and interactions
Cookie Settings
Cookies and similar technologies are used on this website for proper function of the website, for tracking performance analytics and for marketing purposes. We and some of our third-party providers may use cookie data for various purposes. Please review the cookie settings below and choose your preference.
Strictly Necessary: Used for the proper function of the website
Performance/Analytics: Used for monitoring website traffic and interactions
Introduction In the realm of dataanalysis and manipulation, Excel remains a powerhouse tool. Among its many features, the TRANSPOSE function stands out for its ability to reorganize data quickly and efficiently.
In this article, we will explore the mathematical definition of the Poisson process, its parameters and applications, as well as its limitations and extensions. It’s also used in other branches of probability and statistics, including the analysis of data from experiments involving a large number of trials and the study of queues.
ArticleVideo Book This article was published as a part of the Data Science Blogathon Window Functions or Analytic Functions in SQL A window function (or. The post 6 Most Useful SQL Window Functions You Should Definitely Know about! appeared first on Analytics Vidhya.
From ChatGPT, which helps in copywriting, dataanalysis, and summarizing complex research papers, to Midjourney for generating high-definition images with a single prompt, and GitHub Copilot for […] The post 5 MIND-BLOWING AI Tools that Feel Illegal to Know appeared first on Analytics Vidhya.
Introduction Data visualization is a pivotal aspect of dataanalysis, offering an intuitive understanding of complex data through graphical representation. This article talk about the definition, importance, utility, […] The post A Comprehensive Guide to Seaborn Jointplots appeared first on Analytics Vidhya.
Augmented analytics: the combination of AI and analytics is the latest innovation in data analytics. For organizations, dataanalysis has evolved from hiring “unicorn” data scientists – to having smart applications that provide actionable insights for decision-making in just a few clicks, thanks to AI.
Introduction Data visualization is a crucial aspect of dataanalysis, aiding in comprehending and communicating complex datasets. Among the myriad visualization techniques available, area charts stand out for effectively representing quantitative data over time or categories.
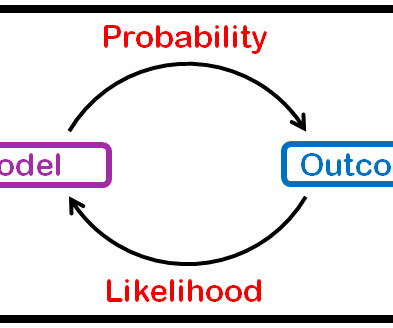
Likelihood and probability are interrelated and often confused terms finding common usage in data science and business. Both probabilities are associated with probabilities but differ in definition and usage. What is Likelihood? We can […] The post What is the Difference Between Likelihood and Probability?
This initial phase of analysis lays the groundwork for more in-depth methods, making it an essential practice in today’s data-driven world. What is data exploration? Data exploration is a vital phase in the dataanalysis process.
Parallel file systems are sophisticated solutions designed to optimize data storage and retrieval processes across multiple networked servers, facilitating robust I/O operations needed in various computing environments. By industry sector National laboratories: Focus on scientific research applications requiring extensive dataanalysis.
Density-based clustering stands out in the realm of dataanalysis, offering unique capabilities to identify natural groupings within complex datasets. Importance of clustering in dataanalysis Clustering is a crucial component of dataanalysis, enabling the exploration of patterns and relationships within large datasets.
Link building basics are easy to grasp, even if you’re completely new to the strategy, but if you want to succeed long-term, you’ll need something more: the ability to measure and analyze data related to your campaign. So why are dataanalysis skills so important here, and what steps can you take to improve your results?
Eliminating data silos enhances decision-making by providing comprehensive insights, improves operational efficiency by streamlining access to information, enriches customer experiences through personalized services, and uncovers new revenue opportunities by enabling targeted marketing strategies based on integrated dataanalysis.
Do you also find it difficult to search for some particular data on an Excel sheet? While we may not be able to help you with the first, we definitely have an Excel function to help you with the second. Introduction Does it take you forever to find your lost sock?
AI Engineers: Your Definitive Career Roadmap Become a professional certified AI engineer by enrolling in the best AI ML Engineer certifications that help you earn skills to get the highest-paying job. Experience working in dataanalysis, software development, and business is also crucial for an AI engineer.
Extrapolation and interpolation are powerful tools in dataanalysis, enabling professionals to make informed predictions and fill in gaps in datasets. These two techniques, while related, have distinct definitions and applications. Lets delve into what these methodologies involve and how they can be applied effectively.
These policies establish a foundation for data usage across an organization. Key components of data governance Key components guide the development of data governance policies, such as: Definition of rights for data citizens: Clearly outlining what data citizens can access and how they can utilize that information.
This article will discuss the definitions […] The post CDF vs PDF: What’s the Difference? Knowing differences between PDF vs CDF is crucial to analyze and interpret the probabilities linked to continuous and discrete random variables. appeared first on Analytics Vidhya.
In a world where data is rapidly generated and accumulated, the ability to distill important features from a vast array of variables can significantly enhance the efficiency and effectiveness of dataanalysis and machine learning models. What is dimensionality reduction?
In the increasingly competitive world, understanding the data and taking quicker actions based on that help create differentiation for the organization to stay ahead! EDA is an iterative process, and is used to uncover hidden insights and uncover relationships within the data.
Unlike traditional research, which starts with a hypothesis, data dredging takes a more exploratory approach. Characteristics of data dredging Data dredging is characterized by certain traits that differentiate it from more robust analytical practices. Utility Despite its risks, data dredging can lead to unexpected findings.
This powerful visualization tool finds applications across diverse fields, from website analytics to retail analysis, helping industries make informed decisions. Heat maps are a powerful data visualization tool that visually represent complex datasets, making it easier to interpret and analyze information. What are heat maps?
Mean absolute percentage error (MAPE) is a crucial metric in the realm of dataanalysis, particularly for those engaged in forecasting. It allows analysts to quantify how well a prediction model performs by comparing predicted values against actual data points.
Ambiguity and misinterpretation: Ambiguities in understanding context can jeopardize learning outcomes, particularly in machine learning, where precise context definition is crucial.
One particularly striking example showcased how a simple change to hyperlink text in search engine advertisements generated an additional $100 million in revenue, demonstrating the remarkable potential of data-driven decision making.
By utilizing algorithms and statistical models, data mining transforms raw data into actionable insights. The data mining process The data mining process is structured into four primary stages: data gathering, data preparation, data mining, and dataanalysis and interpretation.
Definition of conformed dimension In data warehousing, conformed dimensions represent standardized dimensions that different fact tables can reference. The idea is to maintain shared meanings and definitions for specific attributes, such as products or dates, so that reports generated from disparate data marts yield coherent results.
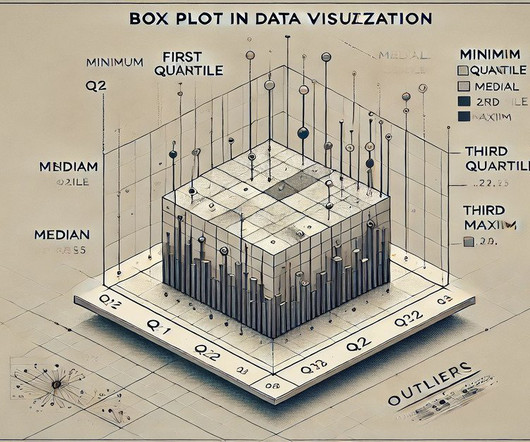
Summary: A Box Plot is a graphical representation summarising data distribution through key statistics like quartiles and outliers. It visualises central tendencies and variability, making it invaluable for DataAnalysis. Summarising data through quartiles highlights key statistics like the median, range, and potential outliers.
It refers to any unintended modifications or loss of data, leading to inaccuracies and potential loss of trust. Definition of data corruption Data corruption occurs when data becomes altered or damaged, whether due to technical faults, user errors, or external threats.
Structured data refers to information that is organized into a well-defined format, allowing for straightforward processing and analysis. This type of data maintains a clear structure, usually in rows and columns, which makes it easy to store and retrieve using database systems.
Summary: The Data Science and DataAnalysis life cycles are systematic processes crucial for uncovering insights from raw data. Quality data is foundational for accurate analysis, ensuring businesses stay competitive in the digital landscape. billion INR by 2026, with a CAGR of 27.7%.
It involves data collection, cleaning, analysis, and interpretation to uncover patterns, trends, and correlations that can drive decision-making. The rise of machine learning applications in healthcare Data scientists, on the other hand, concentrate on dataanalysis and interpretation to extract meaningful insights.
Definition and functionality of LLMs Large language models utilize advanced algorithms to process and generate text, which can mimic human comprehension and articulation. They are the backbone of applications like chatbots, content generators, and dataanalysis tools.
Categorical variables represent data that can be grouped into distinct categories, making them essential for various dataanalysis tasks. Definition and types of categorical data Categorical data can be classified into two primary types: nominal and ordinal. What are categorical variables?
It empowers businesses to manage, process, and analyze large datasets seamlessly, which is particularly crucial in today’s data-driven landscape. By offloading the complexities associated with on-premises data management, organizations can focus more on leveraging data insights to inform decision-making processes.
Definition of target function In the context of AI algorithms, the target function represents the ideal mapping from input features to the expected output. It can be likened to algebraic concepts where the function acts as a blueprint for understanding data relationships.
Whether youre passionate about football or data, this journey highlights how smart analytics can increase performance. Defining the Problem The starting point for any successful data workflow is problem definition. Correcting these issues ensures your analysis is based on clean, reliable data.
For instance, we’re attempting to identify all A-graded students with majors in data science. Keep in mind that CREATE PROCEDURE must be invoked using EXEC in order to be executed, exactly like the function definition. In an inner join, only the rows from both tables that satisfy the specified criteria are displayed.
It is commonly used in regression analysis and forecasting to gauge how well a predictive model performs by contrasting predicted values against observed outcomes. Definition of RMSE RMSE evaluates predictive accuracy by computing the square root of the average of squared differences between predicted and observed outcomes.
Definition and Concept of Curiosity AI Curiosity AI mimics the innate human thirst for knowledge, facilitating advanced learning in computational algorithms. Curiosity AI refers to systems that simulate human-like curiosity, allowing AI to self-learn by seeking out missing information.
Simple Random Sampling Definition and Overview Simple random sampling is a technique in which each member of the population has an equal chance of being selected to form the sample. Analyze the obtained sample data. Analyze the obtained sample data. Collect data from individuals within the selected clusters.
Neural networks utilize statistical methods to learn patterns from data, while symbolic reasoning relies on explicit rules and logic to process information. Definition and purpose Neural networks are designed to mimic human brain functions using layers of interconnected nodes, processing input data through complex mathematical computations.
Martin said that the survey showed that high schools should stress “reasoning and critical thinking skills, decrease the emphasis on specific mathematical topics, and increase the focus on dataanalysis and statistics.” A diversion to dataanalysis risks putting students at a disadvantage.
We organize all of the trending information in your field so you don't have to. Join 17,000+ users and stay up to date on the latest articles your peers are reading.
You know about us, now we want to get to know you!
Let's personalize your content
Let's get even more personalized
We recognize your account from another site in our network, please click 'Send Email' below to continue with verifying your account and setting a password.


Let's personalize your content