This site uses cookies to improve your experience. To help us insure we adhere to various privacy regulations, please select your country/region of residence. If you do not select a country, we will assume you are from the United States. Select your Cookie Settings or view our Privacy Policy and Terms of Use.
Cookie Settings
Cookies and similar technologies are used on this website for proper function of the website, for tracking performance analytics and for marketing purposes. We and some of our third-party providers may use cookie data for various purposes. Please review the cookie settings below and choose your preference.
Used for the proper function of the website
Used for monitoring website traffic and interactions
Cookie Settings
Cookies and similar technologies are used on this website for proper function of the website, for tracking performance analytics and for marketing purposes. We and some of our third-party providers may use cookie data for various purposes. Please review the cookie settings below and choose your preference.
Strictly Necessary: Used for the proper function of the website
Performance/Analytics: Used for monitoring website traffic and interactions
To address this challenge, businesses need to use advanced dataanalysis methods. These methods can help businesses to make sense of their data and to identify trends and patterns that would otherwise be invisible. In recent years, there has been a growing interest in the use of artificial intelligence (AI) for dataanalysis.
Exploratory dataanalysis (EDA) is a critical component of data science that allows analysts to delve into datasets to unearth the underlying patterns and relationships within. EDA serves as a bridge between raw data and actionable insights, making it essential in any data-driven project.
Summary: Big Datavisualization involves representing large datasets graphically to reveal patterns, trends, and insights that are not easily discernible from raw data. quintillion bytes of data daily, the need for effective visualization techniques has never been greater. As we generate approximately 2.5
Summary : Prepare for your datavisualization interview with our guide to the top questions and answers. Introduction Datavisualization is no longer just a niche skill; it’s a fundamental component of DataAnalysis , business intelligence, and data science.
It supports large, multi-dimensional arrays and matrices of numerical data, as well as a large library of mathematical functions to operate on these arrays. The package is particularly useful for performing mathematical operations on large datasets and is widely used in machine learning, dataanalysis, and scientific computing.
It supports large, multi-dimensional arrays and matrices of numerical data, as well as a large library of mathematical functions to operate on these arrays. The package is particularly useful for performing mathematical operations on large datasets and is widely used in machine learning, dataanalysis, and scientific computing.
From data collection to dataanalysis and presentation, this blog will cover it all. Evernote – Evernote is a digital notebook that allows you to capture and organize your research notes, web clippings, and documents. NVivo – Nviva is a software tool for qualitative research and dataanalysis.
While it has always been a data-intensive process, enterprise fraud management today is more complex and more important than ever. This blog post explores the evolving role of enterprise fraud management, examines the impact of AI and showcases the importance of visualdataanalysis. What is enterprise fraud management?
Data scientists are using NLP to make these assistants smarter and more helpful. Enhanced DataVisualization: AI-powered datavisualization tools are enabling data scientists to create interactive and dynamic visualizations that facilitate better communication of insights and findings.
There are many well-known libraries and platforms for dataanalysis such as Pandas and Tableau, in addition to analytical databases like ClickHouse, MariaDB, Apache Druid, Apache Pinot, Google BigQuery, Amazon RedShift, etc. Datavisualization can help here by visualizing your datasets.
The format can be classified by size, but you can choose to organize data horizontally or vertically/by column. It doesn’t matter if you use graphs or charts, you need to get better at datavisualization. It doesn’t matter if you use graphs or charts, you need to get better at datavisualization.
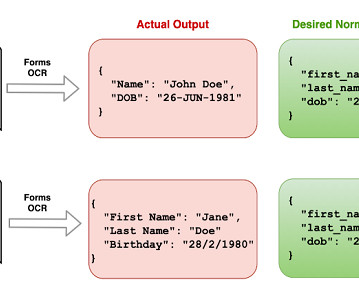
Intelligent Document Processing with AWS, Mastering DataVisualization, GPT-4 Turbo, and ODSC West Keynote Recaps Intelligent Document Processing with AWS AI Services and Amazon Bedrock In this article, we briefly discuss the various phases of IDP and how generative AI is being utilized to augment existing IDP workloads or develop new IDP workloads.
Data-Driven Decision Making With AI’s capability to analyze large sets of data, project managers can now make more informed decisions. AI tools can provide advanced analytics and datavisualizations, contributing to a more data-driven approach to project management.
The increasingly common use of artificial intelligence (AI) is lightening the work burden of product managers (PMs), automating some of the manual, labor-intensive tasks that seem to correspond to a bygone age, such as analyzing data, conducting user research, processing feedback, maintaining accurate documentation, and managing tasks.
This is where a data workflow is essential, allowing you to turn your raw data into actionable insights. In this article, well explore how that workflow covering aspects from data collection to datavisualizations can tackle the real-world challenges.
AI in Word: Smarter Document Creation and Editing One of the most significant innovations in Microsoft 365s AI integration can be seen in Word. Traditionally, Word was known for its word processing features, but with AI, it is transforming into a smarter, more helpful tool for document creation and editing.
Datavisualization: DataVisualization in Python is a project that introduces users to techniques for visually representing data sets. With the help of Python’s data manipulation and visualization libraries, learners can create informative and visually appealing charts, graphs, and plots.
It can do lots of things, like helping with documents and computer coding. ChatGPT Team is packed with features that cater to diverse business needs, enhancing productivity and efficiency: DocumentAnalysis : It enables teams to upload and analyze documents, providing insights and answers to relevant queries.
Several stages of analysis are needed to find insights and make the right decisions related to data, one of which is datavisualization. Datavisualization is an essential part of the dataanalysis process, as it helps to make sense of large and complex data sets. py) or notebook (.ipynb)
Datavisualization tools like Tableau and Power BI can be applied to inform decisions. You document existing workflows, analyse potential improvements, and ensure every recommendation resonates with stakeholders objectives. Q3: Why is documentation essential for a Business Analyst? Who Is a Business Analyst?
With a background in DataVisualization and BI tools, Ive always approached things with a visual mindset. Its primary goal is to create a comprehensive customer data table enriched with information on States, Regions, and Consumer Categories. Document business rules and assumptions directly within the workflow.
Alberto Cairo, datavisualization expert and author of How Charts Lie Whether you are reading a social post, news article or business report, it’s important to know and evaluate the source of the data and charts that you view. To help you question the data, be sure to study the metadata, which is the data about the data.
On a similar note, objective modeling preps an object for maximum visualization through sophisticated analytics features. Helps in the design of simple geometric shapes for visualdataanalysis. Last but not least, DirectX functions allow creating simple geometric shapes that can help in data study.
Learn how Data Scientists use ChatGPT, a potent OpenAI language model, to improve their operations. ChatGPT is essential in the domains of natural language processing, modeling, dataanalysis, data cleaning, and datavisualization. It facilitates exploratory DataAnalysis and provides quick insights.
Introduction to Pandas – The fundamentals Pandas is a popular and powerful open-source dataanalysis and manipulation library for the Python programming language. It is used by us, almighty data scientists and analysts to work with large datasets, perform complex operations, and create powerful datavisualizations.
Using a step-by-step approach, he demonstrated how to integrate AI models with structured databases, enabling automated insights generation, query execution, and datavisualization. Attendees left with a clear understanding of how AI can enhance dataanalysis workflows and improve decision-making in business intelligence applications.
A well-organized portfolio demonstrates your ability to work with data and draw valuable insights. Here are the steps to build an impressive data analyst portfolio: Select Relevant Projects: Choose a variety of dataanalysis projects that highlight your skills and cover different aspects of dataanalysis.
Register the Data Wrangler application within the IdP Refer to the following documentation for the IdPs that Data Wrangler supports: Azure AD Okta Ping Federate Use the documentation provided by your IdP to register your Data Wrangler application. On the Studio Home page, choose Import & prepare datavisually.
Scikit-learn A machine learning powerhouse, Scikit-learn provides a vast collection of algorithms and tools, making it a go-to library for many data scientists. It is easy to use, with a well-documented API and a wide range of tutorials and examples available. Pandas provides a fast and efficient way to work with tabular data.
Matplotlib Cheat Sheet: Simplifying DataVisualization in Python with Quick Tips, Examples, and Essential Techniques for Effective Plotting. Whether you’re a Data Scientist, a researcher, or a student, datavisualization is a crucial skill in today’s world. Matplotlib makes this process a breeze.
Amazon Q can also help employees do more with the vast troves of data and information contained in their company’s documents, systems, and applications by answering questions, providing summaries, generating business intelligence (BI) dashboards and reports, and even generating applications that automate key tasks.
Copilot is deeply integrated into Microsoft’s productivity tools, like Word , Excel , and PowerPoint , making it ideal for tasks involving documents, dataanalysis, and project management. It’s designed to assist with specific workflows and leverage enterprise data, making it a strong tool for businesses.
Whether you are working on dataanalysis, artificial intelligence, web development, or automation, Python has libraries to support your needs. Some popular libraries include: NumPy and Pandas for dataanalysis. If you ever get stuck while coding, you can find answers in online forums, documentation, and tutorials.
From reading data in various formats like CSV, Excel, and SQL to filtering, sorting, and aggregating data, this cheat sheet covers essential operations. It’s a go-to reference for quick and effective data handling, enabling professionals to streamline their dataanalysis processes.
Instead of laboriously scanning through documents, let this plugin do the heavy lifting by answering your queries about the content. AskYourPDF is a real game-changer and firmly stands as one of the best ChatGPT plugins for document handling. Prompt example : “Convert this blog post into a narrated audio file using SpeechKi.”
As a programming language it provides objects, operators and functions allowing you to explore, model and visualise data. The programming language can handle Big Data and perform effective dataanalysis and statistical modelling. R’s workflow support enhances productivity and collaboration among data scientists.
By acquiring expertise in statistical techniques, machine learning professionals can develop more advanced and sophisticated algorithms, which can lead to better outcomes in dataanalysis and prediction. These libraries offer a wide range of functionalities and tools, making it easy to create complex models and conduct dataanalysis.
They keep on adding tutorials and documentation that help the developers and the learner to use this programming language. Versatile programming language- You can use Python for web development, Data Science, Machine Learning, Artificial Intelligence, finance and in many other domains. Python helps in this process.
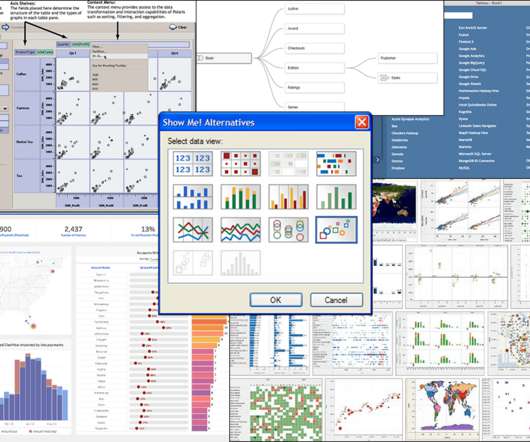
This allows you to explore features spanning more than 40 Tableau releases, including links to release documentation. . In this blog post, I'll describe my analysis of Tableau's history to drive analytics innovation—in particular, I've identified six key innovation vectors through reflecting on the top innovations across Tableau releases.
A cheat sheet for Data Scientists is a concise reference guide, summarizing key concepts, formulas, and best practices in DataAnalysis, statistics, and Machine Learning. It serves as a handy quick-reference tool to assist data professionals in their work, aiding in data interpretation, modeling , and decision-making processes.
It is the process of converting raw data into relevant and practical knowledge to help evaluate the performance of businesses, discover trends, and make well-informed choices. Data gathering, data integration, data modelling, analysis of information, and datavisualization are all part of intelligence for businesses.
Although these two programming languages are used interchangeably, both of them have different objectives to serve when it comes to coding and dataanalysis. Understanding the nuances of Anaconda and Python is crucial for developers, Data Scientists, and programming enthusiasts alike. Is Python bigger than Anaconda?
Data preprocessing is essential for preparing textual data obtained from sources like Twitter for sentiment classification ( Image Credit ) Influence of data preprocessing on text classification Text classification is a significant research area that involves assigning natural language text documents to predefined categories.
This omnipotent tool possesses a profound ability to transmute ordinary individuals into Python-fueled sorcerers, endowing developers with the effortless prowess to conjure captivating web applications that enrapture the senses through unparalleled datavisualization and analytics capabilities. And guess what? and life with it. ?
We organize all of the trending information in your field so you don't have to. Join 17,000+ users and stay up to date on the latest articles your peers are reading.
You know about us, now we want to get to know you!
Let's personalize your content
Let's get even more personalized
We recognize your account from another site in our network, please click 'Send Email' below to continue with verifying your account and setting a password.


Let's personalize your content