This site uses cookies to improve your experience. To help us insure we adhere to various privacy regulations, please select your country/region of residence. If you do not select a country, we will assume you are from the United States. Select your Cookie Settings or view our Privacy Policy and Terms of Use.
Cookie Settings
Cookies and similar technologies are used on this website for proper function of the website, for tracking performance analytics and for marketing purposes. We and some of our third-party providers may use cookie data for various purposes. Please review the cookie settings below and choose your preference.
Used for the proper function of the website
Used for monitoring website traffic and interactions
Cookie Settings
Cookies and similar technologies are used on this website for proper function of the website, for tracking performance analytics and for marketing purposes. We and some of our third-party providers may use cookie data for various purposes. Please review the cookie settings below and choose your preference.
Strictly Necessary: Used for the proper function of the website
Performance/Analytics: Used for monitoring website traffic and interactions
It is practically impossible to test it on every single member of the population. Inferential statistics employ techniques such as hypothesistesting and regression analysis (also discussed later) to determine the likelihood of observed patterns occurring by chance and to estimate population parameters.
How do we link sample spaces and events to data? This means that as the sample size increases, the distribution of the sum or average becomes more tightly clustered around the mean of the distribution, and the shape of the distribution becomes more bell-shaped. One of the most important applications is hypothesistesting. [I
Machine Learning : Supervised and unsupervised learning algorithms, including regression, classification, clustering, and deep learning. Statistics : Fundamental statistical concepts and methods, including hypothesistesting, probability, and descriptive statistics.
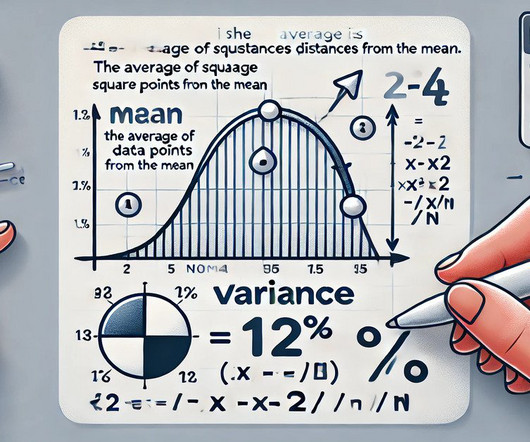
In simple terms, variance captures the degree of “spread-outness” in a dataset—whether the values are clustered closely around the mean or widely dispersed. However, variance offers a clearer mathematical foundation for advanced analyses , such as regression and hypothesistesting. What Does Variance Measure?
Statistics Understand descriptive statistics (mean, median, mode) and inferential statistics (hypothesistesting, confidence intervals). Scikit-learn covers various classification , regression , clustering , and dimensionality reduction algorithms. These concepts help you analyse and interpret data effectively.
HypothesisTesting : Statistical Models help test hypotheses by analysing relationships between variables. They identify patterns in existing data and use them to predict unknown events. These models help in hypothesistesting and determining the relationships between variables.
Different approaches help organisations make sense of raw data, from simply summarising past events to predicting future outcomes. Clustering: Grouping similar data points to identify segments within the data. Techniques HypothesisTesting: Determining whether enough evidence supports a specific claim or hypothesis.
Modeling & Algorithms: Applying statistical models (like regression, classification, clustering) or Machine Learning algorithms to identify deeper patterns, make predictions, or classify data points. Pattern & Trend Spotting: Makes it easier to identify relationships, trends over time, clusters, and anomalies.
Some of the most notable technologies include: Hadoop An open-source framework that allows for distributed storage and processing of large datasets across clusters of computers. Students should understand the concepts of event-driven architecture and stream processing. Knowledge of RESTful APIs and authentication methods is essential.
Clustering: An unsupervised Machine Learning technique that groups similar data points based on their inherent similarities. D Data Mining : The process of discovering patterns, insights, and knowledge from large datasets using various techniques such as classification, clustering, and association rule learning.
There are majorly two categories of sampling techniques based on the usage of statistics, they are: Probability Sampling techniques: Clustered sampling, Simple random sampling, and Stratified sampling. What is the p-value and what does it indicate in the Null Hypothesis? List down the conditions for Overfitting and Underfitting.
We organize all of the trending information in your field so you don't have to. Join 17,000+ users and stay up to date on the latest articles your peers are reading.
You know about us, now we want to get to know you!
Let's personalize your content
Let's get even more personalized
We recognize your account from another site in our network, please click 'Send Email' below to continue with verifying your account and setting a password.


Let's personalize your content