This site uses cookies to improve your experience. To help us insure we adhere to various privacy regulations, please select your country/region of residence. If you do not select a country, we will assume you are from the United States. Select your Cookie Settings or view our Privacy Policy and Terms of Use.
Cookie Settings
Cookies and similar technologies are used on this website for proper function of the website, for tracking performance analytics and for marketing purposes. We and some of our third-party providers may use cookie data for various purposes. Please review the cookie settings below and choose your preference.
Used for the proper function of the website
Used for monitoring website traffic and interactions
Cookie Settings
Cookies and similar technologies are used on this website for proper function of the website, for tracking performance analytics and for marketing purposes. We and some of our third-party providers may use cookie data for various purposes. Please review the cookie settings below and choose your preference.
Strictly Necessary: Used for the proper function of the website
Performance/Analytics: Used for monitoring website traffic and interactions
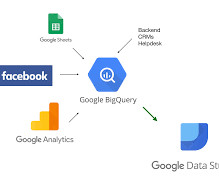
Introduction Google Big Query is a secure, accessible, fully-manage, pay-as-you-go, server-less, multi-clouddata warehouse Platform as a Service (PaaS) service provided by Google Cloud Platform that helps to generate useful insights from big data that will help business stakeholders in effective decision-making.
Recently introduced as part of I BM Knowledge Catalog on Cloud Pak for Data (CP4D) , automated microsegment creation enables businesses to analyze specific subsets of data dynamically, unlocking patterns that drive precise, actionable decisions. Step 4: Press SelectColumn Select the column you want to base segmentation on.
In the sales domain, this enables real-time monitoring of live sales activities, offering immediate insights into performance and rapid response to emerging trends or issues. Data Factory: Data Factory enhances the data integration experience by offering support for over 200 native connectors to both on-premises and clouddata sources.
Sigma Computing , a cloud-based analytics platform, helps data analysts and business professionals maximize their data with collaborative and scalable analytics. One of Sigma’s key features is its support for custom SQL queries and CSV file uploads.
Data can be generated from databases, sensors, social media platforms, APIs, logs, and web scraping. Data can be in structured (like tables in databases), semi-structured (like XML or JSON), or unstructured (like text, audio, and images) form.
Data science involves the use of scientific methods, processes, algorithms, and systems to analyze and interpret data. It integrates aspects from multiple disciplines, including: Statistics : For dataanalysis and interpretation. Business Acumen : To translate data insights into actionable business strategies.
Data science involves the use of scientific methods, processes, algorithms, and systems to analyze and interpret data. It integrates aspects from multiple disciplines, including: Statistics : For dataanalysis and interpretation. Business Acumen : To translate data insights into actionable business strategies.
The lower part of the iceberg is barely visible to the normal analyst on the tool interface, but is essential for implementation and success: this is the Event Log as the data basis for graph and dataanalysis in Process Mining. The creation of this data model requires the data connection to the source system (e.g.
Usually the term refers to the practices, techniques and tools that allow access and delivery through different fields and data structures in an organisation. Data management approaches are varied and may be categorised in the following: Clouddata management. Master data management.
Here’s a list of key skills that are typically covered in a good data science bootcamp: Programming Languages : Python : Widely used for its simplicity and extensive libraries for dataanalysis and machine learning. R : Often used for statistical analysis and data visualization.
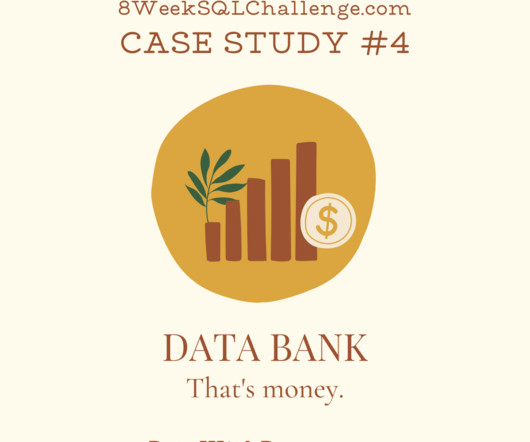
Transaction DataAnalysis—Case Study #4 by Data with Danny As a huge FinTech enthusiast, I found myself totally drawn to this project. Data Bank runs just like any other digital bank — but it isn’t only for banking activities, they also have the world’s most secure distributed data storage platform!
A Matillion pipeline is a collection of jobs that extract, load, and transform (ETL/ELT) data from various sources into a target system, such as a clouddata warehouse like Snowflake. The workflow well reference throughout this blog was built using customer data from TrellisMart, a fictional retail company.
“ Vector Databases are completely different from your clouddata warehouse.” – You might have heard that statement if you are involved in creating vector embeddings for your RAG-based Gen AI applications. For more details, refer to Vector similarity functions. The below flow diagram illustrates this process.
Lookers strength lies in its ability to connect to a wide variety of data sources. Examples include SQl, DWH, and Cloud based systems (Google Bigquery). With Looker, you can share dashboards and visualizations seamlessly across teams, providing stakeholders with access to real-time data.
Data Sharing Enterprises can easily create data sharing relationships with direct, governed, and secure sharing in near-real time. With Snowflake, organizations can be data consumers, data providers, or both.
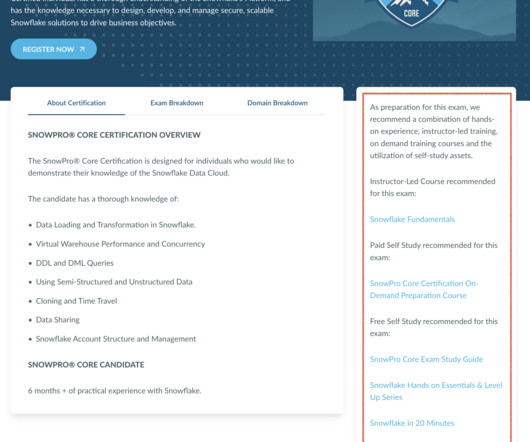
The SnowPro Advanced Administrator Certification targets Snowflake Administrators, Snowflake DataCloud Administrators, Database Administrators, Cloud Infrastructure Administrators, and CloudData Administrators. How Many Days Will It Take to Learn Snowflake?
ThoughtSpot is a cloud-based AI-powered analytics platform that uses natural language processing (NLP) or natural language query (NLQ) to quickly query results and generate visualizations without the user needing to know any SQL or table relations. Why Use ThoughtSpot?
Luckily, there are a few ways we at phData can help you make informed decisions when purchasing inventory and save you money: As mentioned earlier, we have expert data engineers to collect and clean the relevant data needed for inventory analysis, including sales, current inventory levels, seasonal/promotional, and market trend data.
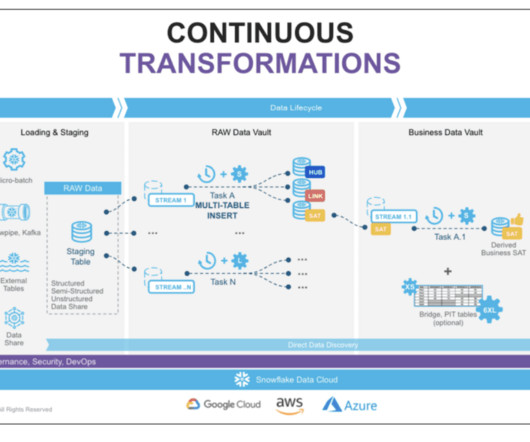
Hashed PKs were introduced as a means of eliminating the bottleneck encountered by most database sequence generators, making this DV pattern ideal for customers prioritizing data loading performance and using data warehouse automation tools. If data is present, Tasks runs SQL to push it to the raw data vault objects.
Youll learn how Datasets empower users to create dynamic reports and dashboards without writing SQL, while also ensuring consistency and reusability across your organization. Key Features of a Dataset in Sigma Analytics Reusable Data Model Datasets can be used across multiple workbooks and analyses, thus preventing redundancy.
We organize all of the trending information in your field so you don't have to. Join 17,000+ users and stay up to date on the latest articles your peers are reading.
You know about us, now we want to get to know you!
Let's personalize your content
Let's get even more personalized
We recognize your account from another site in our network, please click 'Send Email' below to continue with verifying your account and setting a password.


Let's personalize your content