This site uses cookies to improve your experience. To help us insure we adhere to various privacy regulations, please select your country/region of residence. If you do not select a country, we will assume you are from the United States. Select your Cookie Settings or view our Privacy Policy and Terms of Use.
Cookie Settings
Cookies and similar technologies are used on this website for proper function of the website, for tracking performance analytics and for marketing purposes. We and some of our third-party providers may use cookie data for various purposes. Please review the cookie settings below and choose your preference.
Used for the proper function of the website
Used for monitoring website traffic and interactions
Cookie Settings
Cookies and similar technologies are used on this website for proper function of the website, for tracking performance analytics and for marketing purposes. We and some of our third-party providers may use cookie data for various purposes. Please review the cookie settings below and choose your preference.
Strictly Necessary: Used for the proper function of the website
Performance/Analytics: Used for monitoring website traffic and interactions
In this blog, we will discuss exploratorydataanalysis, also known as EDA, and why it is important. We will also be sharing code snippets so you can try out different analysis techniques yourself. This can be useful for identifying patterns and trends in the data. So, without any further ado let’s dive right in.
Data scientists play a crucial role in today’s data-driven world, where extracting meaningful insights from vast amounts of information is key to organizational success. Their work blends statistical analysis, machine learning, and domain expertise to guide strategic decisions across various industries.
For data scrapping a variety of sources, such as online databases, sensor data, or social media. Cleaningdata: Once the data has been gathered, it needs to be cleaned. This involves removing any errors or inconsistencies in the data.
You may combine event data (e.g., shot types and results) with tracking data (e.g., Effective data collection ensures you have all the necessary information to begin the analysis, setting the stage for reliable insights into improving shot conversion rates or any other defined problem.
They employ statistical and mathematical techniques to uncover patterns, trends, and relationships within the data. Data scientists possess a deep understanding of statistical modeling, data visualization, and exploratorydataanalysis to derive actionable insights and drive business decisions.
Pipeline, as it sounds, consists of several activities and tools that are used to move data from one system to another using the same method of data processing and storage. Data pipelines automatically fetch information from various disparate sources for further consolidation and transformation into high-performing data storage.
Today’s question is, “What does a data scientist do.” ” Step into the realm of data science, where numbers dance like fireflies and patterns emerge from the chaos of information. In this blog post, we’re embarking on a thrilling expedition to demystify the enigmatic role of data scientists.
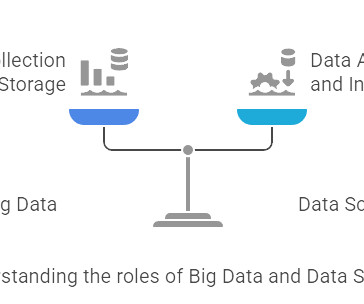
Summary: Big Data refers to the vast volumes of structured and unstructured data generated at high speed, requiring specialized tools for storage and processing. Data Science, on the other hand, uses scientific methods and algorithms to analyses this data, extract insights, and inform decisions.
These figures underscore the significance of comprehending data methodologies for anyone navigating the digital landscape. Understanding Data Science Data Science involves analysing and interpreting complex data sets to uncover valuable insights that can inform decision-making and solve real-world problems.
By analyzing the sentiment of users towards certain products, services, or topics, sentiment analysis provides valuable insights that empower businesses and organizations to make informed decisions, gauge public opinion, and improve customer experiences.
A data analyst deals with a vast amount of information daily. Continuously working with data can sometimes lead to a mistake. In this article, we will be exploring 10 such common mistakes that every data analyst makes. Working with inaccurate or poor quality data may result in flawed outcomes.
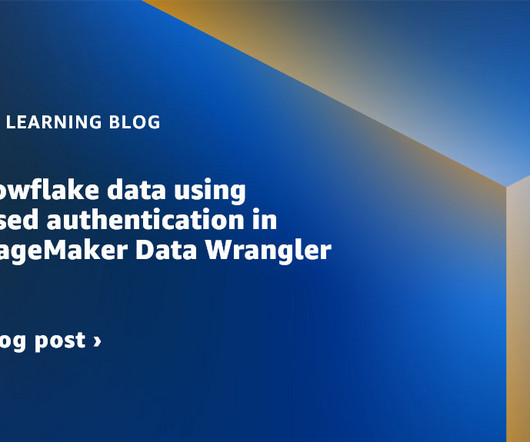
Data Wrangler simplifies the data preparation and feature engineering process, reducing the time it takes from weeks to minutes by providing a single visual interface for data scientists to select and cleandata, create features, and automate data preparation in ML workflows without writing any code.
For Data Analysts needing help, there are numerous resources available, including Stack Overflow, mailing lists, and user-contributed code. The more popular Python becomes, the more users contribute information on their user experience, creating a self-perpetuating spiral of acceptance and support.
Amazon SageMaker Data Wrangler is a single visual interface that reduces the time required to prepare data and perform feature engineering from weeks to minutes with the ability to select and cleandata, create features, and automate data preparation in machine learning (ML) workflows without writing any code.
Provide an in-depth analysis of the pain points that customers may be experiencing that cause them to leave the site without purchasing. With this information, your business could dramatically increase the number of customers leaving your site having purchased a product, improving your customers’ experience while driving sales.
Photo by Juraj Gabriel on Unsplash Dataanalysis is a powerful tool that helps businesses make informed decisions. In this blog, we’ll be using Python to perform exploratorydataanalysis (EDA) on a Netflix dataset that we’ve found on Kaggle. The type column tells us if it is a TV show or a movie.
Introduction In today’s hyper-connected world, we’re drowning in data. From website clicks and social media interactions to sales figures and scientific measurements, information pours in from every direction. But raw data, in its unprocessed state, is often just noise. Deep Dive: What is DataAnalysis?
Summary: AI in Time Series Forecasting revolutionizes predictive analytics by leveraging advanced algorithms to identify patterns and trends in temporal data. This technology enables businesses to make informed decisions, optimize resources, and enhance strategic planning. billion in 2024 and is projected to reach a mark of USD 1339.1
By understanding crucial concepts like Machine Learning, Data Mining, and Predictive Modelling, analysts can communicate effectively, collaborate with cross-functional teams, and make informed decisions that drive business success. Join us as we explore the language of Data Science and unlock your potential as a Data Analyst.
While there are a lot of benefits to using data pipelines, they’re not without limitations. Traditional exploratorydataanalysis is difficult to accomplish using pipelines given that the data transformations achieved at each step are overwritten by the proceeding step in the pipeline. JG : Exactly.
While there are a lot of benefits to using data pipelines, they’re not without limitations. Traditional exploratorydataanalysis is difficult to accomplish using pipelines given that the data transformations achieved at each step are overwritten by the proceeding step in the pipeline. JG : Exactly.
While there are a lot of benefits to using data pipelines, they’re not without limitations. Traditional exploratorydataanalysis is difficult to accomplish using pipelines given that the data transformations achieved at each step are overwritten by the proceeding step in the pipeline. JG : Exactly.
Here are some project ideas suitable for students interested in big data analytics with Python: 1. Kaggle datasets) and use Python’s Pandas library to perform datacleaning, data wrangling, and exploratorydataanalysis (EDA).
This step involves several tasks, including datacleaning, feature selection, feature engineering, and data normalization. Feature Engineering: Feature engineering involves creating new features from existing ones that may be more informative or relevant for the machine learning task.
For example, when customers log onto our website or mobile app, our conversational AI capabilities can help find the information they may want. To borrow another example from Andrew Ng, improving the quality of data can have a tremendous impact on model performance. This is to say that cleandata can better teach our models.
For example, when customers log onto our website or mobile app, our conversational AI capabilities can help find the information they may want. To borrow another example from Andrew Ng, improving the quality of data can have a tremendous impact on model performance. This is to say that cleandata can better teach our models.
Finding the Best CEFR Dictionary This is one of the toughest parts of creating my own machine learning program because cleandata is one of the most important parts. I first tried to scrape the information that I want from a CEFR dictionary in the .txt
It is important to experience such problems as they reflect a lot of the issues that a data practitioner is bound to experience in a business environment. We first get a snapshot of our data by visually inspecting it and also performing minimal ExploratoryDataAnalysis just to make this article easier to follow through.
We organize all of the trending information in your field so you don't have to. Join 17,000+ users and stay up to date on the latest articles your peers are reading.
You know about us, now we want to get to know you!
Let's personalize your content
Let's get even more personalized
We recognize your account from another site in our network, please click 'Send Email' below to continue with verifying your account and setting a password.


Let's personalize your content