This site uses cookies to improve your experience. To help us insure we adhere to various privacy regulations, please select your country/region of residence. If you do not select a country, we will assume you are from the United States. Select your Cookie Settings or view our Privacy Policy and Terms of Use.
Cookie Settings
Cookies and similar technologies are used on this website for proper function of the website, for tracking performance analytics and for marketing purposes. We and some of our third-party providers may use cookie data for various purposes. Please review the cookie settings below and choose your preference.
Used for the proper function of the website
Used for monitoring website traffic and interactions
Cookie Settings
Cookies and similar technologies are used on this website for proper function of the website, for tracking performance analytics and for marketing purposes. We and some of our third-party providers may use cookie data for various purposes. Please review the cookie settings below and choose your preference.
Strictly Necessary: Used for the proper function of the website
Performance/Analytics: Used for monitoring website traffic and interactions
Any serious applications of LLMs require an understanding of nuances in how LLMs work, embeddings, vector databases, retrieval augmented generation (RAG), orchestration frameworks, and more. Vector Similarity Search This video explains what vector databases are and how they can be used for vector similarity searches.
Summary: Data Analysis focuses on extracting meaningful insights from raw data using statistical and analytical methods, while datavisualization transforms these insights into visual formats like graphs and charts for better comprehension. Deep Dive: What is DataVisualization?
The final point to which the data has to be eventually transferred is a destination. The destination is decided by the use case of the data pipeline. It can be used to run analytical tools and power datavisualization as well. Otherwise, it can also be moved to a storage centre like a data warehouse or lake.
By providing a single, unified platform for data storage, management, and analysis, Snowflake connects organizations to leading software vendors specializing in analytics, machine learning, datavisualization, and more.
Each component in this ecosystem is very important in the data-driven decision-making process for an organization. Data Sources and Collection Everything in data science begins with data. Data can be generated from databases, sensors, social media platforms, APIs, logs, and web scraping.
Datavisualization For a long time, Tableau led the industry in datavisualization. This service works with equations and data in spreadsheet form. But it can do what the best visualization tools do: provide conclusions, cleandata, or highlight key information. Documenting with ChatPRD 9.
With Looker’s secure, trusted and highly performant data governance capabilities, we can augment Tableau’s world-class datavisualization capabilities to enable data-driven decisions across the enterprise. Our customers also need a way to easily clean, organize and distribute this data.
With Looker’s secure, trusted and highly performant data governance capabilities, we can augment Tableau’s world-class datavisualization capabilities to enable data-driven decisions across the enterprise. Our customers also need a way to easily clean, organize and distribute this data.
We also reached some incredible milestones with Tableau Prep, our easy-to-use, visual, self-service data prep product. In 2020, we added the ability to write to external databases so you can use cleandata anywhere. Tableau Prep can now be used across more use cases and directly in the browser.
R, on the other hand, is renowned for its powerful statistical capabilities, making it ideal for in-depth Data Analysis and modeling. SQL is essential for querying relational databases, which is a common task in Data Analytics. SQL Structured Query Language (SQL) is essential for Data Analysts working with relational databases.
Data Wrangler simplifies the data preparation and feature engineering process, reducing the time it takes from weeks to minutes by providing a single visual interface for data scientists to select and cleandata, create features, and automate data preparation in ML workflows without writing any code.
Moreover, this feature helps integrate data sets to gain a more comprehensive view or perform complex analyses. DataCleaningData manipulation provides tools to clean and preprocess data. Thus, Cleaningdata ensures data quality and enhances the accuracy of analyses.
Presenters and participants had the opportunity to hear about and evaluate the pros and cons of different back end technologies and data formats for different uses such as web-mapping, datavisualization, and the sharing of meta-data. These can be cleaned to remove artifacts and/or outdated elements.
So, let me present to you an Importing Data in Python Cheat Sheet which will make your life easier. For initiating any data science project, first, you need to analyze the data. From reading CSV files to accessing databases, we will get you covered about anything and everything.
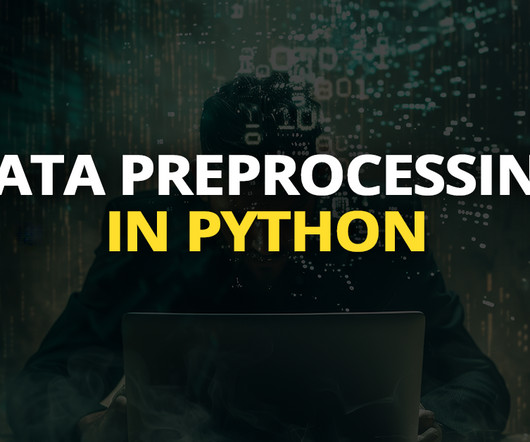
Raw data often contains inconsistencies, missing values, and irrelevant features that can adversely affect the performance of Machine Learning models. Proper preprocessing helps in: Improving Model Accuracy: Cleandata leads to better predictions. Matplotlib/Seaborn: For datavisualization.
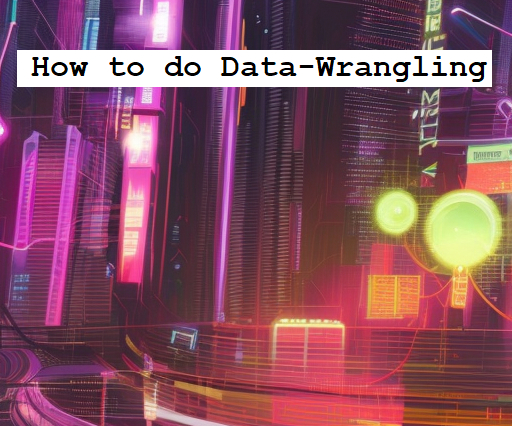
We'll also use numpy and matplotlib libraries for numerical computations and datavisualization. Python import pandas as pd import numpy as np import matplotlib.pyplot as plt Loading Data The first step in data wrangling is loading the data into a Pandas data frame.
Overview of Typical Tasks and Responsibilities in Data Science As a Data Scientist, your daily tasks and responsibilities will encompass many activities. You will collect and cleandata from multiple sources, ensuring it is suitable for analysis. Sources of DataData can come from multiple sources.
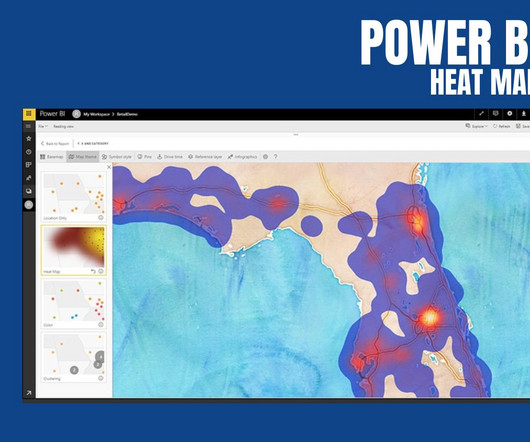
Key Features of Power BI: Power BI is a powerful business intelligence tool developed by Microsoft that enables users to visualize and analyze data from various sources. It offers a wide range of features that make it a popular choice for data professionals, analysts, and organizations.
Data scientists must decide on appropriate strategies to handle missing values, such as imputation with mean or median values or removing instances with missing data. The choice of approach depends on the impact of missing data on the overall dataset and the specific analysis or model being used.
We also reached some incredible milestones with Tableau Prep, our easy-to-use, visual, self-service data prep product. In 2020, we added the ability to write to external databases so you can use cleandata anywhere. Tableau Prep can now be used across more use cases and directly in the browser.
The following figure represents the life cycle of data science. It starts with gathering the business requirements and relevant data. Once the data is acquired, it is maintained by performing datacleaning, data warehousing, data staging, and data architecture. Why is datacleaning crucial?
We organize all of the trending information in your field so you don't have to. Join 17,000+ users and stay up to date on the latest articles your peers are reading.
You know about us, now we want to get to know you!
Let's personalize your content
Let's get even more personalized
We recognize your account from another site in our network, please click 'Send Email' below to continue with verifying your account and setting a password.


Let's personalize your content