This site uses cookies to improve your experience. To help us insure we adhere to various privacy regulations, please select your country/region of residence. If you do not select a country, we will assume you are from the United States. Select your Cookie Settings or view our Privacy Policy and Terms of Use.
Cookie Settings
Cookies and similar technologies are used on this website for proper function of the website, for tracking performance analytics and for marketing purposes. We and some of our third-party providers may use cookie data for various purposes. Please review the cookie settings below and choose your preference.
Used for the proper function of the website
Used for monitoring website traffic and interactions
Cookie Settings
Cookies and similar technologies are used on this website for proper function of the website, for tracking performance analytics and for marketing purposes. We and some of our third-party providers may use cookie data for various purposes. Please review the cookie settings below and choose your preference.
Strictly Necessary: Used for the proper function of the website
Performance/Analytics: Used for monitoring website traffic and interactions
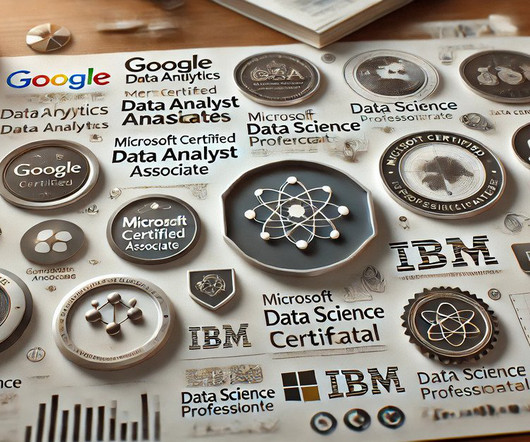
Summary: DataAnalyst certifications are essential for career advancement. Choosing the right certification enhances career growth and opens doors to better opportunities in Data Analytics. Choosing the right certification enhances career growth and opens doors to better opportunities in Data Analytics.
More and more often, businesses are using data to drive their decisions — which makes cutting-edge analytics and businessintelligence strategies one of the best advantages a company can have. Here are the six trends you should be aware of that will reshape businessintelligence in 2020 and throughout the new decade.
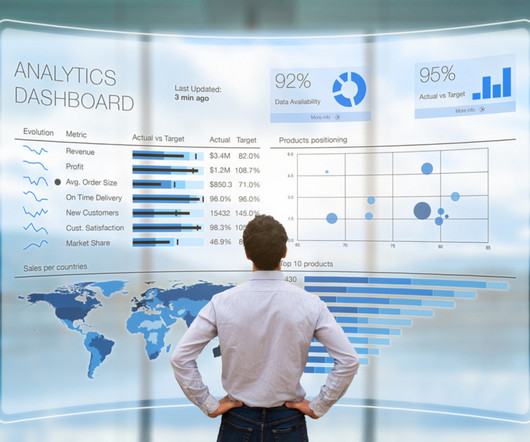
Applications of data analytics Data analytics finds applications across various fields, driving innovation and efficiency. Businessintelligence and reporting Through dashboards and reports, data analytics provides actionable insights into performance metrics, allowing for better decision-making.
Self-service analytics is a subset of businessintelligence (BI) that allows users to access, analyze, and visualize data without extensive IT intervention. This approach streamlines the data analysis process, promoting greater independence and agility for business users. What is self-service analytics?
Business reporting has been around for a long time but the tools and techniques of businessintelligence have refined over time and now with the recent popularity of data driven business approach, data has been identified as the most valuable asset of a business and data analytics and reporting has finally found a key place in the business world.
Summary: Data Visualisation is crucial to ensure effective representation of insights tableau vs power bi are two popular tools for this. This article compares Tableau and Power BI, examining their features, pricing, and suitability for different organisations. What is Tableau? billion in 2023. from 2022 to 2028.
Summary: BusinessIntelligenceAnalysts transform raw data into actionable insights. They use tools and techniques to analyse data, create reports, and support strategic decisions. Key skills include SQL, data visualization, and business acumen. Introduction We are living in an era defined by data.
Kristin Adderson December 19, 2023 - 7:38pm Zach Bowders Tableau Visionary and Tableau Ambassador, BusinessIntelligence Specialist Zach Bowders, MBA is a dataanalyst, artist, and host of the Data+Love Podcast. My first Tableau Public viz was film-centric. That’s what Tableau can do.
In today’s fast-paced business landscape, companies need to stay ahead of the curve to remain competitive. Businessintelligence (BI) has emerged as a key solution to help companies gain insights into their operations and market trends. What is businessintelligence?
In today’s fast-paced business landscape, companies need to stay ahead of the curve to remain competitive. Businessintelligence (BI) has emerged as a key solution to help companies gain insights into their operations and market trends. What is businessintelligence?
The field of data science is now one of the most preferred and lucrative career options available in the area of data because of the increasing dependence on data for decision-making in businesses, which makes the demand for data science hires peak. A DataAnalyst is often called the storyteller of data.
If you’re an aspiring professional in the technological world and love to play with numbers and codes, you have two career paths- DataAnalyst and Data Scientist. What are the critical differences between DataAnalyst vs Data Scientist? Who is a Data Scientist? Who is a DataAnalyst?
” Data visualization and communication It’s not enough to uncover insights from data; a data scientist must also communicate these insights effectively. This is where data visualization comes in. Tools like Tableau, Matplotlib, Seaborn, or Power BI can be incredibly helpful.
One way to stand out as a DataAnalyst is to complete a DataAnalyst Internship. As the field grows intensely popular and competitive, you need to know which area of Data Analytics you’re most suitable for. For entering the industry of Data Analytics, an Internship as a DataAnalyst is the most effective way.
What skills should businessanalysts be focused on developing? For quite some time, the dataanalyst and scientist roles have been universal in nature. The more direct experience and talent an analyst has with automation technology, the more desirable they will be. Basic BusinessIntelligence Experience is a Must.
This comprehensive blog outlines vital aspects of DataAnalyst interviews, offering insights into technical, behavioural, and industry-specific questions. It covers essential topics such as SQL queries, data visualization, statistical analysis, machine learning concepts, and data manipulation techniques.
Tableau is a data visualisation software helping you to generate graphics-rich reporting and analysing enormous volumes of data. With the help of Tableau, organisations have been able to mine and gather actionable insights from granular sources of data. Let’s read the blog to find out!
However, with recent disruption on a global scale, more enterprises are leaning into data for insights and clarity, which accelerates this transformation. And I think it's at the heart of a lot of data cultures that we see people building.”. Here are three ways the cloud injects energy and purpose into a Data Culture.
There are many well-known libraries and platforms for data analysis such as Pandas and Tableau, in addition to analytical databases like ClickHouse, MariaDB, Apache Druid, Apache Pinot, Google BigQuery, Amazon RedShift, etc. This step is important because it’s used to identify any issues or inconsistencies in the data.
It analyzes data to uncover reasons for occurrences, closely related to descriptive analytics for a comprehensive view. Comparison with related concepts Business analytics intersects with several related fields, each with its nuances. Both complement each other but serve different purposes.
Why Switching to Data Analytics is the Right Career Move? There are plenty of contributing factors that make Data Analytics a lucrative career opportunity. Here are some of them: Rising Demand for DataAnalysts – There will be a roaring demand for DataAnalysts in the coming years.
Data analytics is a task that resides under the data science umbrella and is done to query, interpret and visualize datasets. Data scientists will often perform data analysis tasks to understand a dataset or evaluate outcomes. The dedicated dataanalyst Virtually any stakeholder of any discipline can analyze data.
What is BusinessIntelligence? BusinessIntelligence (BI) refers to the technology, techniques, and practises that are used to gather, evaluate, and present information about an organisation in order to assist decision-making and generate effective administrative action. billion in 2015 and reached around $26.50
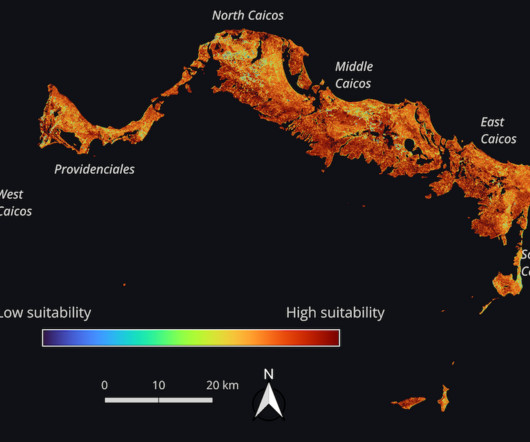
QGIS, Microsoft's Power BI, Tableau, and Jupyter notebooks also facilitated many interesting visualizations, particularly for solvers with less programming experience. Many participants used beginner-friendly online interfaces, like NASA Worldview and Giovanni , to explore and manipulate data. He holds a B.S.
However, with recent disruption on a global scale, more enterprises are leaning into data for insights and clarity, which accelerates this transformation. And I think it's at the heart of a lot of data cultures that we see people building.”. Here are three ways the cloud injects energy and purpose into a Data Culture.
Think of Data Science as the overarching umbrella, covering a wide range of tasks performed to find patterns in large datasets, while Data Analytics is a task that resides under the Data Science umbrella to query, interpret, and visualize datasets. DataAnalysts , however, do not need deep programming knowledge.
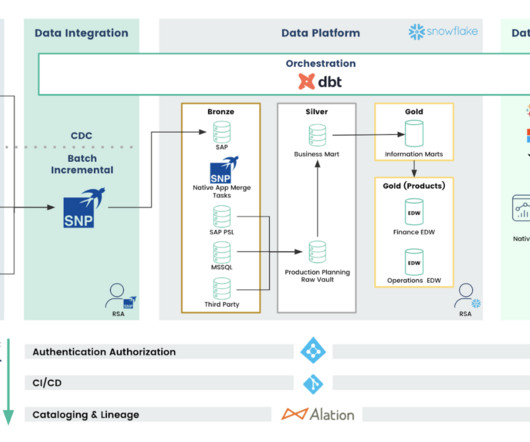
A typical modern data stack consists of the following: A data warehouse. Data ingestion/integration services. Data orchestration tools. Businessintelligence (BI) platforms. These tools are used to manage big data, which is defined as data that is too large or complex to be processed by traditional means.
Technical Skills In todays data-centric landscape, proficiency in advanced analytics tools and software is crucial for an Operations Analyst. Expertise in programs like Microsoft Excel, SQL , and businessintelligence (BI) tools like Power BI or Tableau allows analysts to process and visualise data efficiently.
Profession Description Average per year salary in India Skills required How to gain the skills DataAnalyst Responsibilities include collecting, processing, and analysing data to help organisations make informed decisions. 6,20000 Analytical skills, proficiency in Data Analysis tools (e.g., 12,00000 Programming (e.g.,
Employing a modular structure, SAP ERP encompasses modules such as finance, human resources, supply chain , and more, facilitating real-time collaboration and data sharing across different departments through a centralized database. Example Solution Here is a high-level overview of how the solution works.
Tools Commonly Used BusinessIntelligence Platforms: Tableau, Microsoft Power BI, Qlik Sense, Google Data Studio (Looker Studio) Programming Libraries: Matplotlib, Seaborn (Python); ggplot2 (R); D3.js Now, they need to communicate these findings to the marketing and product teams.
The Business Application Research Center (BARC) is a European analyst firm headquartered in Germany. The firm focuses on business software that supports businessintelligence, analytics, data management, and other key data areas. Download the full report.
Price Optimization Software Tools like PROS or Vendavo use advanced algorithms to analyse historical sales data and predict optimal prices based on various factors such as demand elasticity and competitor actions.
Here are some key tips on how to create an effective job description for your Data Science resume : Start with a Strong Title Focus on making your resume clear and concise. For example, you can use standard job titles like Data Scientist, DataAnalyst or Machine Learning engineer.
Application of SQL in Data Analysis In the case of Data Analysis, SQL plays a crucial role and in real-world situations, a dataanalyst is able to use SQL for accessing, reading, manipulating and analyzing the data from a database.
Scikit-Learn: A versatile library for Machine Learning in Python that offers simple and efficient data mining and analysis tools. Tableau: A leading Data Visualisation tool that allows users to create interactive and shareable dashboards. Data Science Job Guarantee Course by Pickl.AI
We organize all of the trending information in your field so you don't have to. Join 17,000+ users and stay up to date on the latest articles your peers are reading.
You know about us, now we want to get to know you!
Let's personalize your content
Let's get even more personalized
We recognize your account from another site in our network, please click 'Send Email' below to continue with verifying your account and setting a password.


Let's personalize your content