This site uses cookies to improve your experience. To help us insure we adhere to various privacy regulations, please select your country/region of residence. If you do not select a country, we will assume you are from the United States. Select your Cookie Settings or view our Privacy Policy and Terms of Use.
Cookie Settings
Cookies and similar technologies are used on this website for proper function of the website, for tracking performance analytics and for marketing purposes. We and some of our third-party providers may use cookie data for various purposes. Please review the cookie settings below and choose your preference.
Used for the proper function of the website
Used for monitoring website traffic and interactions
Cookie Settings
Cookies and similar technologies are used on this website for proper function of the website, for tracking performance analytics and for marketing purposes. We and some of our third-party providers may use cookie data for various purposes. Please review the cookie settings below and choose your preference.
Strictly Necessary: Used for the proper function of the website
Performance/Analytics: Used for monitoring website traffic and interactions
ArticleVideo Book This article was published as a part of the DataScience Blogathon Introduction In applied Statistics and Machine Learning, DataVisualization is one. The post Must Known DataVisualization Techniques for DataScience appeared first on Analytics Vidhya.
ArticleVideo Book This article was published as a part of the DataScience Blogathon DataVisualizationDataVisualization techniques involve the generation of graphical or. The post Effective DataVisualization Techniques in DataScience Using Python appeared first on Analytics Vidhya.
ArticleVideo Book This article was published as a part of the DataScience Blogathon. What is datavisualization? ” The post A Complete Beginner’s Guide to DataVisualization appeared first on Analytics Vidhya. “A picture speaks a thousand words.”
ArticleVideo Book This article was published as a part of the DataScience Blogathon Introduction Matplotlib is a widely used library for datavisualizations. The post Exploring Matplotlib Stylesheets For DataVisualization appeared first on Analytics Vidhya. Matplotlib.
ArticleVideo Book This article was published as a part of the DataScience Blogathon DATAVISUALIZATION: DataVisualization is one of the parts of descriptive. The post DATAVISUALIZATION : What Is This And Why It Matters appeared first on Analytics Vidhya.
Introduction Datascience has taken over all economic sectors in recent times. To achieve maximum efficiency, every company strives to use various data at every stage of its operations.
ArticleVideo Book This article was published as a part of the DataScience Blogathon Introduction Visualization leverages the power of data in getting insights and. The post Cyberpunk Themed Charts: Advanced DataVisualization in Python appeared first on Analytics Vidhya.
ArticleVideo Book This article was published as a part of the DataScience Blogathon Introduction Datavisualization is the most important step in the life. The post How To Perform DataVisualization with Pandas appeared first on Analytics Vidhya.
ArticleVideo Book This article was published as a part of the DataScience Blogathon Introduction DataVisualization helps to bridge the gap between numbers and. The post Plotly and cufflinks : Advanced Python DataVisualization Libraries appeared first on Analytics Vidhya.
ArticleVideo Book This article was published as a part of the DataScience Blogathon Like the evolution of humans, datavisualization techniques have also been. The post Lollipop Charts: Advanced DataVisualization in Python appeared first on Analytics Vidhya.
ArticleVideo Book This article was published as a part of the DataScience Blogathon Introduction: Seaborn is a Python datavisualization library based on the. The post DataVisualization Using Seaborn For Beginners appeared first on Analytics Vidhya.
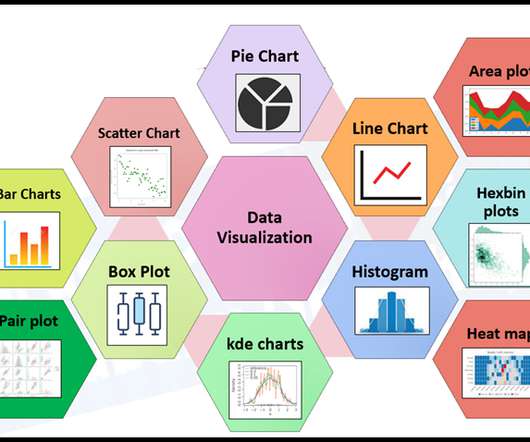
ArticleVideo Book This article was published as a part of the DataScience Blogathon Introduction Human beings are amongst the most creative species on this. The post 8 Charts You Must Know To Excel In The Art of DataVisualization! appeared first on Analytics Vidhya.
ArticleVideo Book This article was published as a part of the DataScience Blogathon. Datavisualization is a process to represent. The post DataVisualizations In Julia Using Plots.jl: With Practical Implementation appeared first on Analytics Vidhya. Introduction Hello Readers!!
ArticleVideo Book This article was published as a part of the DataScience Blogathon Introduction Data is everywhere in today’s world of data, and we. The post Interactive DataVisualization Plots with Plotly and Cufflinks appeared first on Analytics Vidhya.
ChatGPT plugins can be used to extend the capabilities of ChatGPT in a variety of ways, such as: Accessing and processing external data Performing complex computations Using third-party services In this article, we’ll dive into the top 6 ChatGPT plugins tailored for datascience. Source: Datacamp 4.
ArticleVideo Book This article was published as a part of the DataScience Blogathon Introduction We all love exploring data. Representing data and interpreting or. The post Understanding Bar Plots in Python : Beginner’s Guide to DataVisualization appeared first on Analytics Vidhya.
ArticleVideo Book This article was published as a part of the DataScience Blogathon Introduction The twenty-first century can be regarded as the era of. The post Donut Plots : DataVisualization With Python appeared first on Analytics Vidhya.
ArticleVideo Book This article was published as a part of the DataScience Blogathon Datavisualization and its importance Let’s see what does technical definition. The post DataVisualization – A Useful tool to Explore Data appeared first on Analytics Vidhya.
ArticleVideo Book This article was published as a part of the DataScience Blogathon Introduction Our world is becoming more and more digital, especially after. The post Emojize Your DataScience Projects appeared first on Analytics Vidhya.
7 Tips To Produce Readable DataScience Code • 30 Resources for Mastering DataVisualization • 15 More Free Machine Learning and Deep Learning Books • Simple and Fast Data Streaming for Machine Learning Projects • The AI Education Gap and How to Close It.
ArticleVideo Book This article was published as a part of the DataScience Blogathon Photo by fauxels from Pexels What is Exploratory Data Analysis? The post Exploratory Data Analysis and Visualization Techniques in DataScience appeared first on Analytics Vidhya. Exploratory.
ArticleVideo Book This article was published as a part of the DataScience Blogathon. This article helps in understanding the importance of data. The post Guide to DataVisualization and Insights appeared first on Analytics Vidhya.
ArticleVideo Book This article was published as a part of the DataScience Blogathon Introduction Have you ever got confused by reading those large data. The post DataVisualization Techniques You MUST Know as a Data Scientist appeared first on Analytics Vidhya.
ArticleVideo Book This article was published as a part of the DataScience Blogathon. The post Mastering Exploratory Data Analysis(EDA) For DataScience Enthusiasts appeared first on Analytics Vidhya. Overview Step by Step approach to Perform EDA Resources Like.
ArticleVideo Book This article was published as a part of the DataScience Blogathon. Introduction Datavisualization is the practice of translating data into. The post Top 10 DataVisualization Tools appeared first on Analytics Vidhya.
ArticleVideo Book Introduction to Artificial Intelligence and Machine Learning Artificial Intelligence (AI) and its sub-field Machine Learning (ML) have taken the world by storm. The post A Comprehensive Step-by-Step Guide to Become an Industry Ready DataScience Professional appeared first on Analytics Vidhya.
ArticleVideo Book This article was published as a part of the DataScience Blogathon Data is everywhere you just need an eye to select which. The post Tricks for Datavisualization using Plotly Library appeared first on Analytics Vidhya.
ArticleVideo Book This article was published as a part of the DataScience Blogathon Introduction Hello, Welcome to the world of EDA using DataVisualization. The post Exploratory Data Analysis using DataVisualization Techniques! appeared first on Analytics Vidhya.
ArticleVideo Book This article was published as a part of the DataScience Blogathon. The post Animated Bar Graph: DataScience Project appeared first on Analytics Vidhya. A quick and step-by-step beginners project to create an animated.
ArticleVideo Book This article was published as a part of the DataScience Blogathon. Image Source Introduction We can say that datavisualization is basically. The post Visualizing Netflix Data Using Python! appeared first on Analytics Vidhya.
ArticleVideo Book Introduction In this article, we are going to go through the popular Titanic dataset and try to predict whether a person. The post Titanic survivors, a guide for your first DataScience project appeared first on Analytics Vidhya.
ArticleVideo Book This article was published as a part of the DataScience Blogathon DataVisualization is a revolutionary invention that is widely used today. The post Build Treemaps in Python using Squarify appeared first on Analytics Vidhya.
ArticleVideo Book This article was published as a part of the DataScience Blogathon. Datavisualization is an important and useful stage in a Data. The post A Gentle Introduction to Bokeh: Interactive Python Plotting Library appeared first on Analytics Vidhya.
ArticleVideo Book This article was published as a part of the DataScience Blogathon Introduction Plotting is essentially one of the most important steps in. The post Plotting Visualizations Out of Pandas DataFrames appeared first on Analytics Vidhya.
ArticleVideo Book This article was published as a part of the DataScience Blogathon. “Understand your customer better, with data !!” ” Introduction Did you. The post Customer Loyalty Program with Python appeared first on Analytics Vidhya.
ArticleVideo Book This article was published as a part of the DataScience Blogathon. Introduction The majority of corporates or services rely highly upon. The post Classifying DDoS attacks with Artificial Intelligence appeared first on Analytics Vidhya.
Big data and datascience in the digital age The digital age has resulted in the generation of enormous amounts of data daily, ranging from social media interactions to online shopping habits. quintillion bytes of data are created. This is where datascience plays a crucial role. What is datascience?
ArticleVideo Book This article was published as a part of the DataScience Blogathon Introduction Image Source: Author DataScience enthusiasts know that raw data. The post Better EDA with 3 Easy Python Libraries for Any Beginner appeared first on Analytics Vidhya.
ArticleVideo Book This article was published as a part of the DataScience Blogathon Introduction Sometimes it is just convenient to leave the driving to. The post Uber and Lyft Cab Prices : Data Analysis and Visualization appeared first on Analytics Vidhya.
ArticleVideo Book This article was published as a part of the DataScience Blogathon. Introduction Machine Learning is the trending digital technology in today’s world, The post Bar Chart Race of World Population by 2020 in Python appeared first on Analytics Vidhya.
ArticleVideo Book This article was published as a part of the DataScience Blogathon. A beginner’s guide to select plots for Visualization appeared first on Analytics Vidhya. ‘The greatest value of a picture is when it forces. The post When to use what plot ?
ArticleVideo Book This article was published as a part of the DataScience Blogathon Introduction Sounds can become wrangled within the datascience field through. The post Visualizing Sounds Using Librosa Machine Learning Library! appeared first on Analytics Vidhya.
ArticleVideo Book This article was published as a part of the DataScience Blogathon. Introduction Natural Language Processing, typically abbreviated as NLP, The post Speed Up Text Pre Processing Using TextHero Python Library appeared first on Analytics Vidhya.
ArticleVideo Book This article was published as a part of the DataScience Blogathon. Introduction Tableau is a powerful DataVisualization software, and much. The post Building a Covid-19 Vaccination Dashboard in Tableau appeared first on Analytics Vidhya.
We organize all of the trending information in your field so you don't have to. Join 17,000+ users and stay up to date on the latest articles your peers are reading.
You know about us, now we want to get to know you!
Let's personalize your content
Let's get even more personalized
We recognize your account from another site in our network, please click 'Send Email' below to continue with verifying your account and setting a password.


Let's personalize your content