This site uses cookies to improve your experience. To help us insure we adhere to various privacy regulations, please select your country/region of residence. If you do not select a country, we will assume you are from the United States. Select your Cookie Settings or view our Privacy Policy and Terms of Use.
Cookie Settings
Cookies and similar technologies are used on this website for proper function of the website, for tracking performance analytics and for marketing purposes. We and some of our third-party providers may use cookie data for various purposes. Please review the cookie settings below and choose your preference.
Used for the proper function of the website
Used for monitoring website traffic and interactions
Cookie Settings
Cookies and similar technologies are used on this website for proper function of the website, for tracking performance analytics and for marketing purposes. We and some of our third-party providers may use cookie data for various purposes. Please review the cookie settings below and choose your preference.
Strictly Necessary: Used for the proper function of the website
Performance/Analytics: Used for monitoring website traffic and interactions
ArticleVideo Book This article was published as a part of the Data Science Blogathon Introduction Data Cleansing is the process of analyzing data for finding. The post Data Cleansing: How To CleanData With Python! appeared first on Analytics Vidhya.
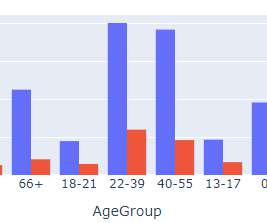
Descriptive statistics Grouping and aggregating: One way to explore a dataset is by grouping the data by one or more variables, and then aggregating the data by calculating summary statistics. This can be useful for identifying patterns and trends in the data.
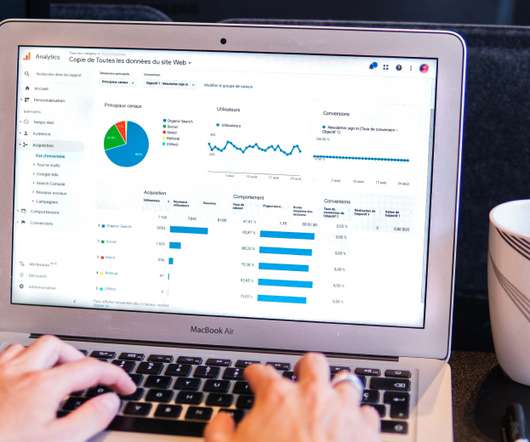
Accordingly, Data Analysts use various tools for Data Analysis and Excel is one of the most common. Significantly, the use of Excel in Data Analysis is beneficial in keeping records of data over time and enabling datavisualization effectively. How to use Excel in Data Analysis and why is it important?
Data Wrangler simplifies the data preparation and feature engineering process, reducing the time it takes from weeks to minutes by providing a single visual interface for data scientists to select and cleandata, create features, and automate data preparation in ML workflows without writing any code.
Presenters and participants had the opportunity to hear about and evaluate the pros and cons of different back end technologies and data formats for different uses such as web-mapping, datavisualization, and the sharing of meta-data. These can be cleaned to remove artifacts and/or outdated elements.
We organize all of the trending information in your field so you don't have to. Join 17,000+ users and stay up to date on the latest articles your peers are reading.
You know about us, now we want to get to know you!
Let's personalize your content
Let's get even more personalized
We recognize your account from another site in our network, please click 'Send Email' below to continue with verifying your account and setting a password.


Let's personalize your content