This site uses cookies to improve your experience. To help us insure we adhere to various privacy regulations, please select your country/region of residence. If you do not select a country, we will assume you are from the United States. Select your Cookie Settings or view our Privacy Policy and Terms of Use.
Cookie Settings
Cookies and similar technologies are used on this website for proper function of the website, for tracking performance analytics and for marketing purposes. We and some of our third-party providers may use cookie data for various purposes. Please review the cookie settings below and choose your preference.
Used for the proper function of the website
Used for monitoring website traffic and interactions
Cookie Settings
Cookies and similar technologies are used on this website for proper function of the website, for tracking performance analytics and for marketing purposes. We and some of our third-party providers may use cookie data for various purposes. Please review the cookie settings below and choose your preference.
Strictly Necessary: Used for the proper function of the website
Performance/Analytics: Used for monitoring website traffic and interactions
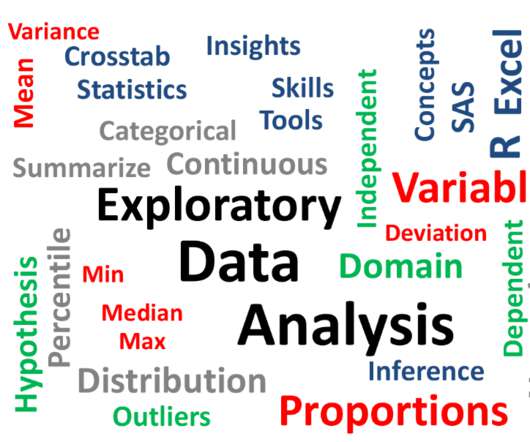
In this blog, we will discuss exploratory dataanalysis, also known as EDA, and why it is important. We will also be sharing code snippets so you can try out different analysis techniques yourself. EDA is an iterative process of conglomerative activities which include data cleaning, manipulation and visualization.
Introduction Welcome to our comprehensive dataanalysisblog that delves deep into the world of Netflix. Netflix’s Global Reach Netflix […] The post Netflix Case Study (EDA): Unveiling Data-Driven Strategies for Streaming appeared first on Analytics Vidhya.
ArticleVideo Book This article was published as a part of the Data Science Blogathon Hi all, this is my first blog hope you all like. The post Performing Exploratory DataAnalysis with SAS and Python appeared first on Analytics Vidhya.
Source: Stephen Wolfram Writings Read this blog to Master ChatGPT cheatsheet 2. Here are some examples of how you can use the Noteable Notebook plugin for ChatGPT: Exploratory DataAnalysis (EDA): You can use the plugin to generate descriptive statistics, create visualizations, and identify patterns in your data.
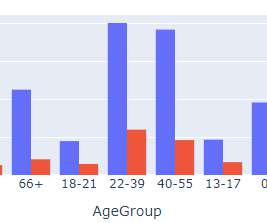
The importance of EDA in the machine learning world is well known to its users. Making visualizations is one of the finest ways for data scientists to explain dataanalysis to people outside the business. Exploratory dataanalysis can help you comprehend your data better, which can aid in future data preprocessing.
With its advanced natural language processing capabilities, ChatGPT can uncover hidden patterns and trends in your data that you never thought possible. In this blog post, we’ll explore how ChatGPT can revolutionize your data with […] The post Analyzing Data Made Effortless Using ChatGPT appeared first on Analytics Vidhya.
Introduction Analytics Vidhya DataHour is designed to provide valuable insights and knowledge to individuals looking to build a career in the data-tech industry. These sessions cover a wide range of topics, from the fields of artificial intelligence, and machine learning, and various topics related to data science.
For data scrapping a variety of sources, such as online databases, sensor data, or social media. Cleaning data: Once the data has been gathered, it needs to be cleaned. This involves removing any errors or inconsistencies in the data.
Many beginners in data science and machine learning only focus on the dataanalysis and model development part, which is understandable, as the other department often does the deployment process. We will walk through it together, from the dataanalysis to automatic retraining. Establish a Data Science Project2.
I discuss why I went from five to two plot types in my preliminary EDA. I also have created a Github for all code in this blog. The GitHub… Continue reading on MLearning.ai »
Photo by Juraj Gabriel on Unsplash Dataanalysis is a powerful tool that helps businesses make informed decisions. In today’s blog, we will explore the Netflix dataset using Python and uncover some interesting insights. Submission Suggestions Netflix DataAnalysis using Python was originally published in MLearning.ai
Some projects may necessitate a comprehensive LLMOps approach, spanning tasks from data preparation to pipeline production. Exploratory DataAnalysis (EDA) Data collection: The first step in LLMOps is to collect the data that will be used to train the LLM.
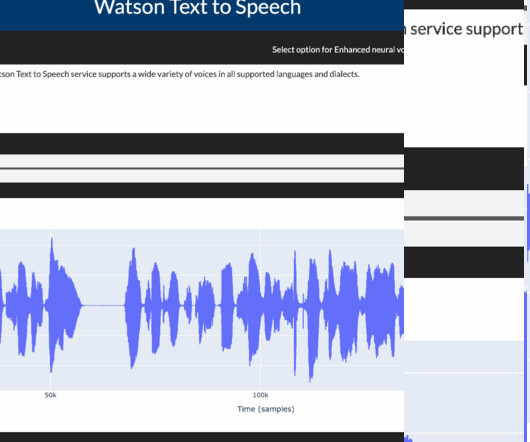
Text to Speech Dash app IBM Watson’s text-to-speech model is built using machine learning techniques and deep neural networks, trained on large amounts of speech and text data. This blog gives an overview of how to convert text data into speech and how to control speech rate & voice pitch using Watson Speech libraries.
According to a report from Statista, the global big data market is expected to grow to over $103 billion by 2027, highlighting the increasing importance of data handling practices. Key Takeaways Data preprocessing is crucial for effective Machine Learning model training. During EDA, you can: Check for missing values.
As semiconductor manufacturers look to innovate quickly, electronic design automation (EDA) tools can be a key asset. HPC can accelerate the end-to-end design and development process, all the way from helping automotive engineers optimize fuel consumption to improving driver safety with the help of advanced simulations and dataanalysis.
Exploratory DataAnalysis(EDA)on Biological Data: A Hands-On Guide Unraveling the Structural Data of Proteins, Part II — Exploratory DataAnalysis Photo from Pexels In a previous post, I covered the background of this protein structure resolution data set, including an explanation of key data terminology and details on how to acquire the data.
And importantly, starting naively annotating data might become a quick solution rather than thinking about how to make uses of limited labels if extracting data itself is easy and does not cost so much. In that case, you tasks have your own problem, and you would have to be careful about your EDA, data cleaning, and labeling.
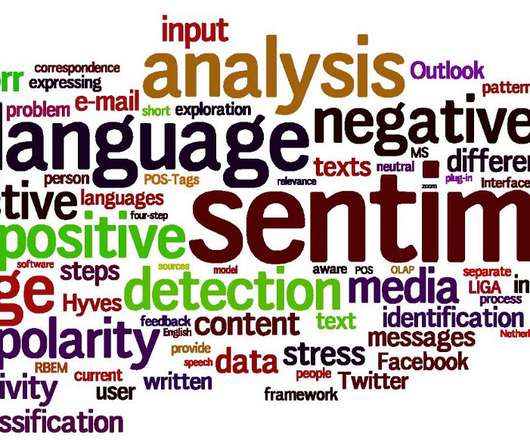
By analyzing the sentiment of users towards certain products, services, or topics, sentiment analysis provides valuable insights that empower businesses and organizations to make informed decisions, gauge public opinion, and improve customer experiences. It ensures that the data used in analysis or modeling is comprehensive and comprehensive.
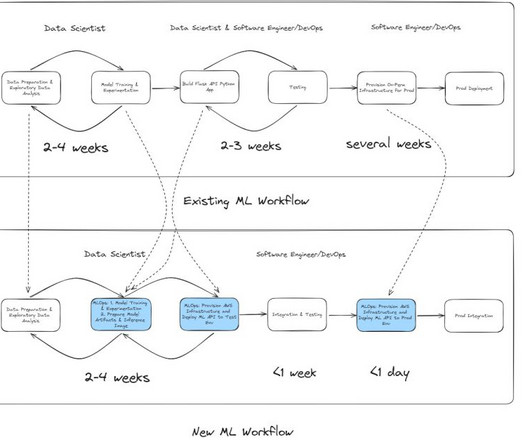
Legacy workflow: On-premises ML development and deployment When the data science team needed to build a new fraud detection model, the development process typically took 24 weeks.
These communities will help you to be updated in the field, because there are some experienced data scientists posting the stuff, or you can talk with them so they will also guide you in your journey. DataAnalysis After learning math now, you are able to talk with your data.
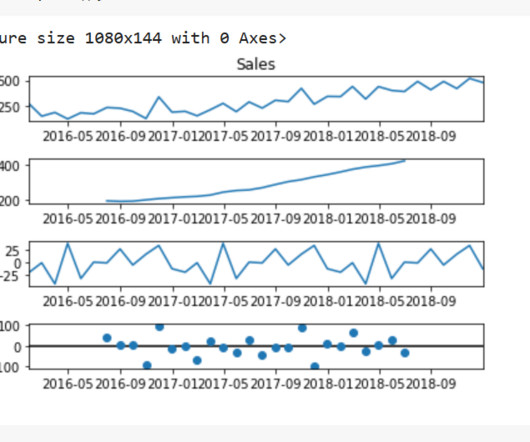
We will carry out some EDA on our dataset, and then we will log the visualizations onto the Comet experimentation website or platform. Time Series Models Time series models are a type of statistical model that are used to analyze and make predictions about data that is collected over time. Without further ado, let’s begin.
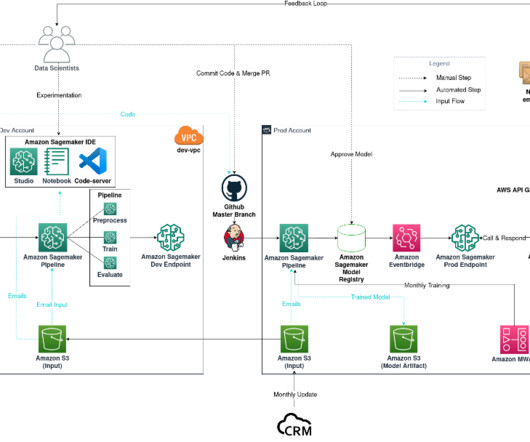
Email classification project diagram The workflow consists of the following components: Model experimentation – Data scientists use Amazon SageMaker Studio to carry out the first steps in the data science lifecycle: exploratory dataanalysis (EDA), data cleaning and preparation, and building prototype models.
Comet is an MLOps platform that offers a suite of tools for machine-learning experimentation and dataanalysis. It is designed to make it easy to track and monitor experiments and conduct exploratory dataanalysis (EDA) using popular Python visualization frameworks. What is Comet?
Today’s question is, “What does a data scientist do.” ” Step into the realm of data science, where numbers dance like fireflies and patterns emerge from the chaos of information. In this blog post, we’re embarking on a thrilling expedition to demystify the enigmatic role of data scientists.
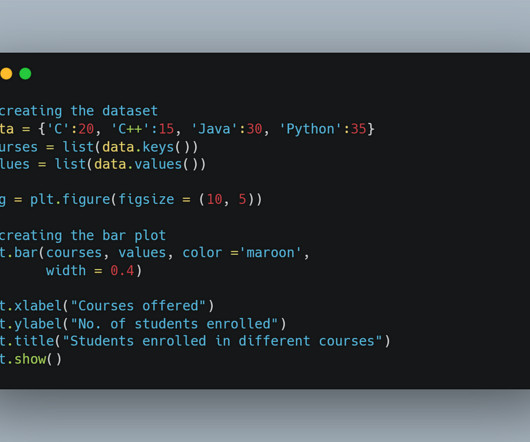
Introduction Data visualisation plays a crucial role in DataAnalysis by transforming complex datasets into insightful, easy-to-understand visuals. Python data visualisation libraries offer powerful visualisation tools , ranging from simple charts to interactive dashboards.
At the core of Data Science lies the art of transforming raw data into actionable information that can guide strategic decisions. Role of Data Scientists Data Scientists are the architects of dataanalysis. They clean and preprocess the data to remove inconsistencies and ensure its quality.
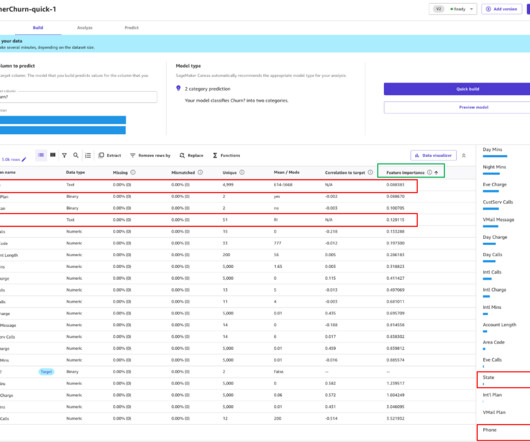
Figure 7: Using SageMaker Data Wrangler’s chat for data prep to run SQL statements Check for data quality SageMaker Canvas also provides exploratory dataanalysis (EDA) capabilities that allow you to gain deeper insights into the data prior to the ML model build step.
Data Extraction, Preprocessing & EDA & Machine Learning Model development Data collection : Automatically download the stock historical prices data in CSV format and save it to the AWS S3 bucket. Data storage : Store the data in a Snowflake data warehouse by creating a data pipe between AWS and Snowflake.
It supports label-based indexing for precise data retrieval and manipulation, crucial for practical dataanalysis. Introduction Pandas is a powerful library in Python that excels in dataanalysis, offering efficient data manipulation capabilities. What is a Pandas DataFrame?
In order to accomplish this, we will perform some EDA on the Disneyland dataset, and then we will view the visualization on the Comet experimentation website or platform. Another significant aspect of Comet is that it enables us to carry out exploratory dataanalysis. Let’s get started! You can learn more about Comet here.
We use the model preview functionality to perform an initial EDA. This provides us a baseline that we can use to perform data augmentation, generating a new baseline, and finally getting the best model with a model-centric approach using the standard build functionality.
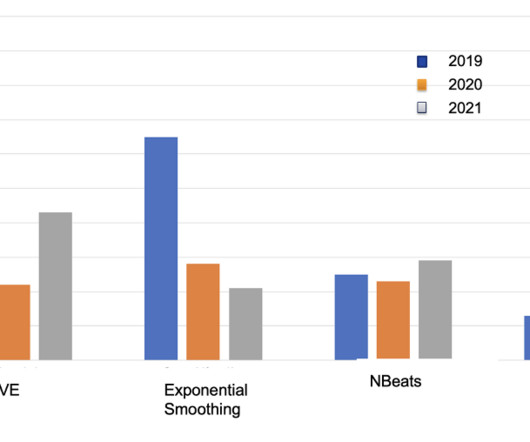
We observed during the exploratory dataanalysis (EDA) that as we move from micro-level sales (product level) to macro-level sales (BL level), missing values become less significant. However, the maximum length of historical sales data (maximum length of 140 months) still posed significant challenges in terms of model accuracy.
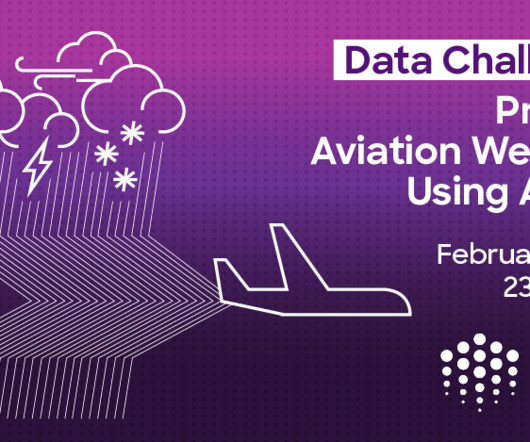
This is a unique opportunity for data people to dive into real-world data and uncover insights that could shape the future of aviation safety, understanding, airline efficiency, and pilots driving planes. Stay tuned for updates and discussions on our blog page blog.oceanprotocol.com for progress throughout the year!
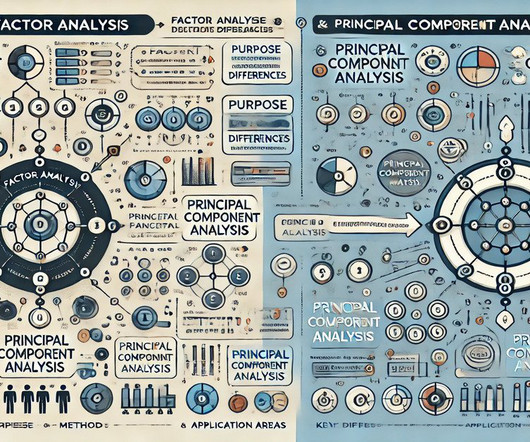
Understanding their differences helps you choose the right tool for identifying hidden factors or simplifying data in fields like psychology, market research, genomics, and finance. Introduction Factor Analysis (FA) and Principal Component Analysis (PCA) are powerful statistical techniques use for DataAnalysis.
I initially conducted detailed exploratory dataanalysis (EDA) to understand the dataset, identifying challenges like duplicate entries and missing Coordinate Reference System (CRS) information.
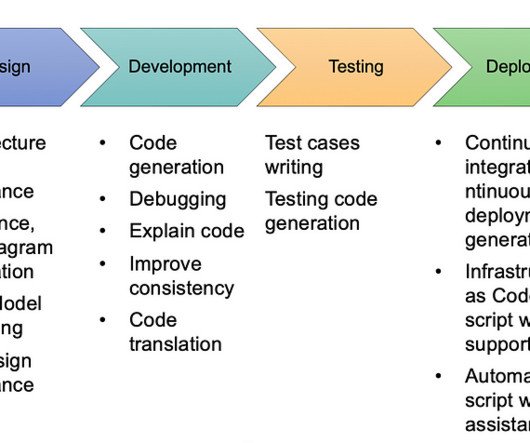
Blog - Everest Group Requirements gathering: ChatGPT can significantly simplify the requirements gathering phase by building quick prototypes of complex applications. GPT-4 Data Pipelines: Transform JSON to SQL Schema Instantly Blockstream’s public Bitcoin API. The data would be interesting to analyze.
In a typical MLOps project, similar scheduling is essential to handle new data and track model performance continuously. Load and Explore Data We load the Telco Customer Churn dataset and perform exploratory dataanalysis (EDA). Experiment Tracking in CometML (Image by the Author) 2.
If you want to become an efficient Data Scientist and grab that job role you’ve been looking for, you need to work on Github for Data Science projects. Some of the Data Science Projects on Github that you work upon have been listed in this blog. Top 10 Best Data Science Project on Github 1. Let’s take a look!
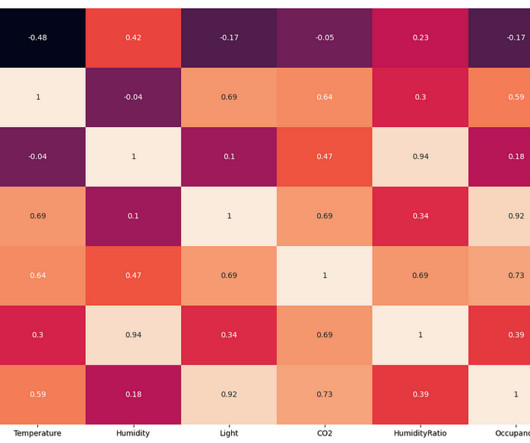
From the above EDA, it is clear that the room's temperature, light, and CO2 levels are good occupancy indicators. The exploratory dataanalysis found that the change in room temperature, CO levels, and light intensity can be used to predict the occupancy of the room in place of humidity and humidity ratio.
Vertex AI combines data engineering, data science, and ML engineering into a single, cohesive environment, making it easier for data scientists and ML engineers to build, deploy, and manage ML models. Data Preparation Begin by ingesting and analysing your dataset.
This blog will explore the intricacies of AI Time Series Forecasting, its challenges, popular models, implementation steps, applications, tools, and future trends. Making Data Stationary: Many forecasting models assume stationarity. In 2024, the global Time Series Forecasting market was valued at approximately USD 214.6
Create DataGrids with image data using Kangas, and load and visualize image data from hugging face Photo by Genny Dimitrakopoulou on Unsplash Visualizing data to carry out a detailed EDA, especially for image data, is critical. We pay our contributors, and we don’t sell ads.
There are 6 high-level steps in every MLOps project The 6 steps are: Initial data gathering (for exploration). Exploratory dataanalysis (EDA) and modeling. Data and model pipeline development (data preparation, training, evaluation, and so on).
Jump Right To The Downloads Section Scaling Kaggle Competitions Using XGBoost: Part 2 In the previous blog post of this series, we briefly covered concepts like decision trees and gradient boosting, before touching up on the concept of XGBoost. Looking for the source code to this post? Subsequently, we saw how easy it was to use in code. .
We organize all of the trending information in your field so you don't have to. Join 17,000+ users and stay up to date on the latest articles your peers are reading.
You know about us, now we want to get to know you!
Let's personalize your content
Let's get even more personalized
We recognize your account from another site in our network, please click 'Send Email' below to continue with verifying your account and setting a password.


Let's personalize your content