This site uses cookies to improve your experience. To help us insure we adhere to various privacy regulations, please select your country/region of residence. If you do not select a country, we will assume you are from the United States. Select your Cookie Settings or view our Privacy Policy and Terms of Use.
Cookie Settings
Cookies and similar technologies are used on this website for proper function of the website, for tracking performance analytics and for marketing purposes. We and some of our third-party providers may use cookie data for various purposes. Please review the cookie settings below and choose your preference.
Used for the proper function of the website
Used for monitoring website traffic and interactions
Cookie Settings
Cookies and similar technologies are used on this website for proper function of the website, for tracking performance analytics and for marketing purposes. We and some of our third-party providers may use cookie data for various purposes. Please review the cookie settings below and choose your preference.
Strictly Necessary: Used for the proper function of the website
Performance/Analytics: Used for monitoring website traffic and interactions
Visualizations close the gap between bigdata and a more understandable realization of the data provided. Microsoft’s PowerBI tool is an […] The post Most Used 10 PowerBI Charts appeared first on Analytics Vidhya.
Overview A demonstration of statistical analytics by Integrating Python within PowerBI Share the findings using dashboards and reports Introduction PowerBI is. The post Integrating Python in PowerBI: Get the best of both worlds appeared first on Analytics Vidhya.
Summary: BigDatavisualization involves representing large datasets graphically to reveal patterns, trends, and insights that are not easily discernible from raw data. quintillion bytes of data daily, the need for effective visualization techniques has never been greater. As we generate approximately 2.5
Summary : Prepare for your datavisualization interview with our guide to the top questions and answers. Introduction Datavisualization is no longer just a niche skill; it’s a fundamental component of Data Analysis , business intelligence, and data science. Preparing for these questions is crucial.
Their role is crucial in understanding the underlying data structures and how to leverage them for insights. Key Skills Proficiency in SQL is essential, along with experience in datavisualization tools such as Tableau or PowerBI.
Link to the repository: [link] Apache Spark: An open-source distributed computing system used for bigdata processing. It can be used for creating interactive visualizations, animations, and more. Link to the repository: [link] Looking to begin exploring, analyzing, and visualizingdata with PowerBI Desktop?
Microsoft Fabric combines multiple elements into a single platform – Image courtesy of Microsoft The contribution of PowerBI The integration of Microsoft PowerBI and Microsoft Fabric offers a powerful combination for organizations seeking comprehensive data analytics and insights.
A Data Product can take various forms, depending on the domain’s requirements and the data it manages. It could be a curated dataset, a machine learning model, an API that exposes data, a real-time data stream, a datavisualization dashboard, or any other data-related asset that provides value to the organization.
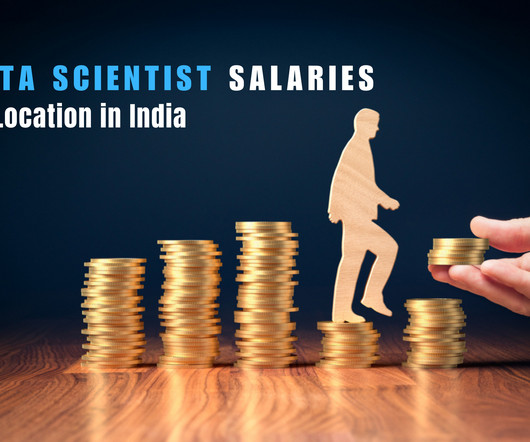
Key Takeaways Data scientists in India require strong programming and machine learning skills for diverse industries. Bigdata and cloud technologies are increasingly important in Indian data science roles. Data scientists in India use a broad toolkit tailored to local industry needs: Programming: Python, R, SQL.
Introduction In the rapidly evolving landscape of data analytics, Business Intelligence (BI) tools have become indispensable for organizations seeking to leverage their bigdata stores for strategic decision-making. There is a plethora of BI tools available in the market today, with new ones being added yearly.
Data Storage and Management Once data have been collected from the sources, they must be secured and made accessible. The responsibilities of this phase can be handled with traditional databases (MySQL, PostgreSQL), cloud storage (AWS S3, Google Cloud Storage), and bigdata frameworks (Hadoop, Apache Spark).
Summary: A comprehensive BigData syllabus encompasses foundational concepts, essential technologies, data collection and storage methods, processing and analysis techniques, and visualisation strategies. Fundamentals of BigData Understanding the fundamentals of BigData is crucial for anyone entering this field.
Even if you don’t have a degree, you might still be pondering, “How to become a data scientist?” ” Datavisualization and communication It’s not enough to uncover insights from data; a data scientist must also communicate these insights effectively. Works with smaller data sets.
Introduction Not a single day passes without us getting to hear the word “data.” This is precisely what happens in data analytics. People equipped with the […] The post 10 Best Data Analytics Projects appeared first on Analytics Vidhya. It is almost as if our lives revolve around it. Don’t they?
Data science bootcamps are intensive short-term educational programs designed to equip individuals with the skills needed to enter or advance in the field of data science. They cover a wide range of topics, ranging from Python, R, and statistics to machine learning and datavisualization.
Key Tools and Techniques Business Analytics employs various tools and techniques to process and interpret data effectively. Dashboards, such as those built using Tableau or PowerBI , provide real-time visualizations that help track key performance indicators (KPIs). Data Scientists require a robust technical foundation.
It is ideal for handling unstructured or semi-structured data, making it perfect for modern applications that require scalability and fast access. Apache Spark Apache Spark is a powerfuldata processing framework that efficiently handles BigData. The global BigData and data engineering market, valued at $75.55
Data professionals are in high demand all over the globe due to the rise in bigdata. The roles of data scientists and data analysts cannot be over-emphasized as they are needed to support decision-making. This article will serve as an ultimate guide to choosing between Data Science and Data Analytics.
As businesses increasingly rely on data-driven strategies, the global BI market is projected to reach US$36.35 The rise of bigdata, along with advancements in technology, has led to a surge in the adoption of BI tools across various sectors. Data Processing: Cleaning and organizing data for analysis.
To pursue a data science career, you need a deep understanding and expansive knowledge of machine learning and AI. To pursue a data science career, you need a deep understanding and expansive knowledge of machine learning and AI. And you should have experience working with bigdata platforms such as Hadoop or Apache Spark.
As you’ll see below, however, a growing number of data analytics platforms, skills, and frameworks have altered the traditional view of what a data analyst is. Data Presentation: Communication Skills, DataVisualization Any good data analyst can go beyond just number crunching.
They create data pipelines, ETL processes, and databases to facilitate smooth data flow and storage. With expertise in programming languages like Python , Java , SQL, and knowledge of bigdata technologies like Hadoop and Spark, data engineers optimize pipelines for data scientists and analysts to access valuable insights efficiently.
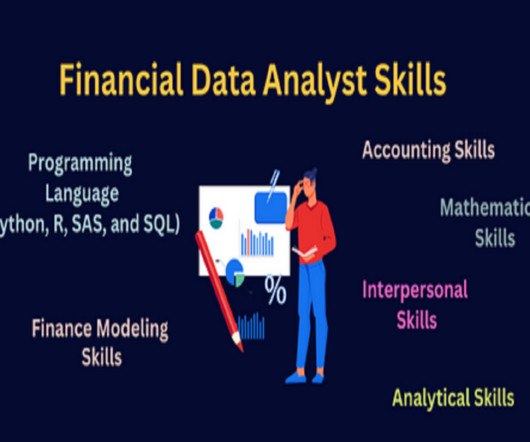
Summary: Leveraging data skills for Financial Analysts explores how Financial Analysts can harness data skills to enhance their roles. It delves into data analysis techniques to interpret financial trends effectively, including statistical analysis and datavisualization. appeared first on Pickl.AI.
Tableau further has its own drawbacks in case of its use in Data Science considering it is a Data Analysis tool rather than a tool for Data Science. How Professionals Can Use Tableau for Data Science? Professionals can connect to various data sources, including databases, spreadsheets, and bigdata platforms.
This explosive growth is driven by the increasing volume of data generated daily, with estimates suggesting that by 2025, there will be around 181 zettabytes of data created globally. The field has evolved significantly from traditional statistical analysis to include sophisticated Machine Learning algorithms and BigData technologies.
They store structured data in a format that facilitates easy access and analysis. Data Lakes: These store raw, unprocessed data in its original format. They are useful for bigdata analytics where flexibility is needed. These tools work together to facilitate efficient data management and analysis processes.
Understanding Data Structured Data: Organized data with a clear format, often found in databases or spreadsheets. Unstructured Data: Data without a predefined structure, like text documents, social media posts, or images. Data Cleaning: Process of identifying and correcting errors or inconsistencies in datasets.
Scala is worth knowing if youre looking to branch into data engineering and working with bigdata more as its helpful for scaling applications. Data Engineering Data engineering remains integral to many data science roles, with workflow pipelines being a key focus.
Here is the tabular representation of the same: Technical Skills Non-technical Skills Programming Languages: Python, SQL, R Good written and oral communication Data Analysis: Pandas, Matplotlib, Numpy, Seaborn Ability to work in a team ML Algorithms: Regression Classification, Decision Trees, Regression Analysis Problem-solving capability BigData: (..)
Unified Data Services: Azure Synapse Analytics combines bigdata and data warehousing, offering a unified analytics experience. Azure’s global network of data centres ensures high availability and performance, making it a powerful platform for Data Scientists to leverage for diverse data-driven projects.
Data ingestion/integration services. Data orchestration tools. Business intelligence (BI) platforms. These tools are used to manage bigdata, which is defined as data that is too large or complex to be processed by traditional means. How Did the Modern Data Stack Get Started? Reverse ETL tools.
This comprehensive blog outlines vital aspects of Data Analyst interviews, offering insights into technical, behavioural, and industry-specific questions. It covers essential topics such as SQL queries, datavisualization, statistical analysis, machine learning concepts, and data manipulation techniques.
BigData Analytics This involves analyzing massive datasets that are too large and complex for traditional data analysis methods. BigData Analytics is used in healthcare to improve operational efficiency, identify fraud, and conduct large-scale population health studies.
We organize all of the trending information in your field so you don't have to. Join 17,000+ users and stay up to date on the latest articles your peers are reading.
You know about us, now we want to get to know you!
Let's personalize your content
Let's get even more personalized
We recognize your account from another site in our network, please click 'Send Email' below to continue with verifying your account and setting a password.


Let's personalize your content