This site uses cookies to improve your experience. To help us insure we adhere to various privacy regulations, please select your country/region of residence. If you do not select a country, we will assume you are from the United States. Select your Cookie Settings or view our Privacy Policy and Terms of Use.
Cookie Settings
Cookies and similar technologies are used on this website for proper function of the website, for tracking performance analytics and for marketing purposes. We and some of our third-party providers may use cookie data for various purposes. Please review the cookie settings below and choose your preference.
Used for the proper function of the website
Used for monitoring website traffic and interactions
Cookie Settings
Cookies and similar technologies are used on this website for proper function of the website, for tracking performance analytics and for marketing purposes. We and some of our third-party providers may use cookie data for various purposes. Please review the cookie settings below and choose your preference.
Strictly Necessary: Used for the proper function of the website
Performance/Analytics: Used for monitoring website traffic and interactions
Bigdata is conventionally understood in terms of its scale. This one-dimensional approach, however, runs the risk of simplifying the complexity of bigdata. In this blog, we discuss the 10 Vs as metrics to gauge the complexity of bigdata. Big numbers carry the immediate appeal of bigdata.
Summary: BigDatavisualization involves representing large datasets graphically to reveal patterns, trends, and insights that are not easily discernible from raw data. quintillion bytes of data daily, the need for effective visualization techniques has never been greater. As we generate approximately 2.5
Datavisualization is an essential tool in the modern landscape of information management, turning complex data into accessible visuals that can facilitate clearer understanding. With the exponential growth of data, the need to effectively interpret vast amounts of information has never been more critical.
That’s akin to the experience of sifting through today’s digital news landscape, except instead of a magical test, we have the power of dataanalysis to help us find the news that matters most to us. What if you could take a test that magically guides you to the knowledge that interests you most?
There are countless examples of bigdata transforming many different industries. It can be used for something as visual as reducing traffic jams, to personalizing products and services, to improving the experience in multiplayer video games. We would like to talk about datavisualization and its role in the bigdata movement.
For instance, Berkeley’s Division of Data Science and Information points out that entry level data science jobs remote in healthcare involves skills in NLP (Natural Language Processing) for patient and genomic dataanalysis, whereas remote data science jobs in finance leans more on skills in risk modeling and quantitative analysis.
Introduction Do you feel like you’re drowning in data? Tools for dataanalysis and visualisation are crucial for contemporary decision-making. They assist us in understanding complex data and locating crucial insights. The graph is shown here.
Summary : Prepare for your datavisualization interview with our guide to the top questions and answers. Introduction Datavisualization is no longer just a niche skill; it’s a fundamental component of DataAnalysis , business intelligence, and data science.
The conference brings together business leaders, data analysts, and technology professionals to discuss the latest trends and innovations in data and analytics, and how they can be applied to drive business success. The conference takes place annually in Santa Clara, California, United States. PAW Climate and Deep Learning World.
Libraries and Tools: Libraries like Pandas, NumPy, Scikit-learn, Matplotlib, Seaborn, and Tableau are like specialized tools for dataanalysis, visualization, and machine learning. Data Cleaning and Preprocessing Before analyzing data, it often needs a cleanup. It’s like deciphering a secret code.
Introduction Welcome to our comprehensive dataanalysis blog that delves deep into the world of Netflix. Netflix’s Global Reach Netflix […] The post Netflix Case Study (EDA): Unveiling Data-Driven Strategies for Streaming appeared first on Analytics Vidhya.
We have previously written about the benefits of datavisualization, including its advantages with content marketing. Datavisualization techniques like the box plot are instrumental in modern dataanalysis. They provide a comprehensive visual representation of a data set’s distribution and spread.
Bigdata and data science in the digital age The digital age has resulted in the generation of enormous amounts of data daily, ranging from social media interactions to online shopping habits. quintillion bytes of data are created. It is estimated that every day, 2.5
Bigdata has been billed as being the future of business for quite some time. Analysts have found that the market for bigdata jobs increased 23% between 2014 and 2019. The impact of bigdata is felt across all sectors of the economy. However, the future is now. Choose a Career. Learn How To Be Practical.
By employing various methodologies, analysts uncover hidden patterns, predict outcomes, and support data-driven decision-making. Understanding these techniques can enhance a data scientist’s toolkit, making it easier to navigate the complexities of bigdata. What are data science techniques?
The good news is that you don’t need to be an engineer, scientist, or programmer to acquire the necessary dataanalysis skills. Whether you’re located anywhere in the world or belong to any profession, you can still develop the expertise needed to be a skilled data analyst. Who are data analysts?
It’s like the detective’s toolkit, providing the tools to analyze and interpret data. Think of it as the ability to read between the lines of the data and uncover hidden patterns. DataAnalysis and Interpretation: Data scientists use statistics to understand what the data is telling them.
Link to the repository: [link] Apache Spark: An open-source distributed computing system used for bigdata processing. Seaborn: A Python datavisualization library based on matplotlib. It provides a range of statistical graphics and visualization tools.
Bigdata technology has had a number of important benefits for businesses in all industries. One of the biggest advantages is that bigdata helps companies utilize business intelligence. It is one of the biggest reasons that the market for bigdata is projected to be worth $273 billion by 2026.
Companies use Business Intelligence (BI), Data Science , and Process Mining to leverage data for better decision-making, improve operational efficiency, and gain a competitive edge. A Data Product can take various forms, depending on the domain’s requirements and the data it manages.
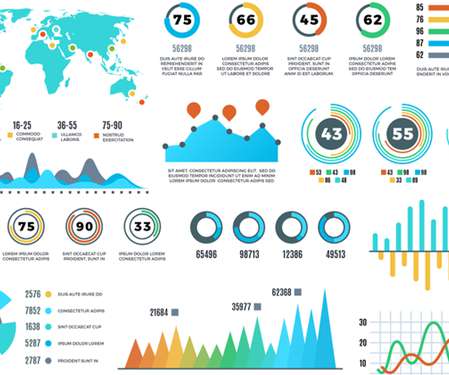
Summary: Datavisualization is essential for interpreting complex information. This article covers various types of datavisualization, such as bar charts, line graphs, and heat maps. This blog will explore various types of datavisualization, their unique features, and when to use them.
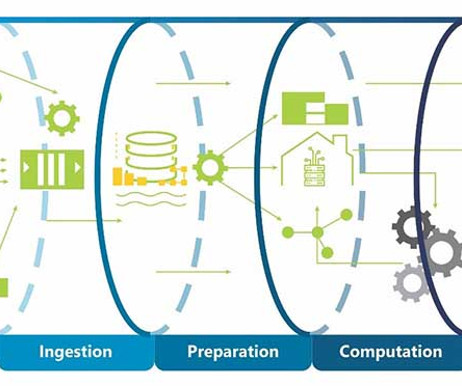
With the explosive growth of bigdata over the past decade and the daily surge in data volumes, it’s essential to have a resilient system to manage the vast influx of information without failures. The success of any data initiative hinges on the robustness and flexibility of its bigdata pipeline.
Machine learning engineer vs data scientist: The growing importance of both roles Machine learning and data science have become integral components of modern businesses across various industries. Machine learning, a subset of artificial intelligence , enables systems to learn and improve from data without being explicitly programmed.
Akridata, a software company that provides an end-to-end suite of products that support both the smart ingestion and smart exploration of visualdata to reduce cost and complexity while accelerating business value, announced the official launch of Akridata Data Explorer, its platform that provides data science teams the tools to easily explore, search, (..)
Bigdata is shaping our world in countless ways. Data powers everything we do. Exactly why, the systems have to ensure adequate, accurate and most importantly, consistent data flow between different systems. The final point to which the data has to be eventually transferred is a destination.
Key Takeaways Data scientists in India require strong programming and machine learning skills for diverse industries. Bigdata and cloud technologies are increasingly important in Indian data science roles. Data quality issues are common in Indian datasets, so cleaning and preprocessing are critical.
Visualization tools Azure Data Studio includes insightful widgets that help visualize query results. The ability to generate charts and graphs directly from T-SQL queries with JSON output further enhances dataanalysis capabilities. It has a reduced learning curve, helping new users quickly become proficient.
The Bureau of Labor Statistics estimates that the number of data scientists will increase from 32,700 to 37,700 between 2019 and 2029. Unfortunately, despite the growing interest in bigdata careers, many people don’t know how to pursue them properly. What is Data Science? It hosts a dataanalysis competition.
However, computerization in the digital age creates massive volumes of data, which has resulted in the formation of several industries, all of which rely on data and its ever-increasing relevance. Data analytics and visualization help with many such use cases. It is the time of bigdata. Prioritize.
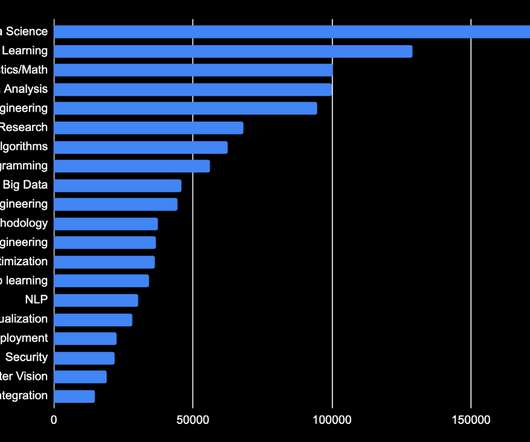
Analytics and DataAnalysis Coming in as the 4th most sought-after skill is data analytics, as many data scientists will be expected to do some analysis in their careers. BigData As datasets become larger and more complex, knowing how to work with them will be key.
Introduction In the rapidly evolving landscape of data analytics, Business Intelligence (BI) tools have become indispensable for organizations seeking to leverage their bigdata stores for strategic decision-making. Tableau – Tableau is celebrated for its advanced datavisualization and interactive dashboard features.
Working with massive structured and unstructured data sets can turn out to be complicated. It’s obvious that you’ll want to use bigdata, but it’s not so obvious how you’re going to work with it. So, let’s have a close look at some of the best strategies to work with large data sets.
If you are considering a data analyst career, here are some reasons that may help solidify your decision. Unsurprisingly, those pursuing careers in dataanalysis are highly sought after. As a data analyst, you will learn several technical skills that data analysts need to be successful, including: Programming skills.
Data science bootcamps are intensive short-term educational programs designed to equip individuals with the skills needed to enter or advance in the field of data science. They cover a wide range of topics, ranging from Python, R, and statistics to machine learning and datavisualization.
Key Skills Required Knowledge of Algorithms and Predictive Models: Proficiency in using algorithms and predictive models to forecast future trends based on present data. DataVisualization Techniques: Ability to transform complex data into understandable graphs and charts. Your Next Step: Explore the Field!
Business reporting has been around for a long time but the tools and techniques of business intelligence have refined over time and now with the recent popularity of data driven business approach, data has been identified as the most valuable asset of a business and data analytics and reporting has finally found a key place in the business world.
Techniques in advanced analytics Organizations employ a variety of techniques for effective dataanalysis, each suited for different types of insights. Data mining This technique focuses on discovering patterns and relationships within large datasets, providing valuable insights across various industries.
Data Storage and Management Once data have been collected from the sources, they must be secured and made accessible. The responsibilities of this phase can be handled with traditional databases (MySQL, PostgreSQL), cloud storage (AWS S3, Google Cloud Storage), and bigdata frameworks (Hadoop, Apache Spark).
Navigate through 6 Popular Python Libraries for Data Science R R is another important language, particularly valued in statistics and dataanalysis, making it useful for AI applications that require intensive data processing. C++ C++ is essential for AI engineering due to its efficiency and control over system resources.
Basic knowledge of statistics is essential for data science. Statistics is broadly categorized into two types – Descriptive statistics – Descriptive statistics is describing the data. Visual graphs are the core of descriptive statistics. Exploratory DataAnalysis. Use cases of data science.
Given your extensive background in administration and management, how do you envision specific data science tools, such as predictive analytics, machine learning, and datavisualization, and methodologies like data mining and bigdataanalysis, could enhance public administration and investment management?
Data Analytics in the Age of AI, When to Use RAG, Examples of DataVisualization with D3 and Vega, and ODSC East Selling Out Soon Data Analytics in the Age of AI Let’s explore the multifaceted ways in which AI is revolutionizing data analytics, making it more accessible, efficient, and insightful than ever before.
Introduction Data Science is everywhere in the 21st century and has emerged as an innovative field. But what exactly is Data Science? And why should one consider specializing in it? This blog post aims to answer these questions and more.
In this digital world, Data is the backbone of all businesses. With such large-scale data production, it is essential to have a field that focuses on deriving insights from it. What is data analytics? What tools help in data analytics? How can data analytics be applied to various industries?
We organize all of the trending information in your field so you don't have to. Join 17,000+ users and stay up to date on the latest articles your peers are reading.
You know about us, now we want to get to know you!
Let's personalize your content
Let's get even more personalized
We recognize your account from another site in our network, please click 'Send Email' below to continue with verifying your account and setting a password.


Let's personalize your content