This site uses cookies to improve your experience. To help us insure we adhere to various privacy regulations, please select your country/region of residence. If you do not select a country, we will assume you are from the United States. Select your Cookie Settings or view our Privacy Policy and Terms of Use.
Cookie Settings
Cookies and similar technologies are used on this website for proper function of the website, for tracking performance analytics and for marketing purposes. We and some of our third-party providers may use cookie data for various purposes. Please review the cookie settings below and choose your preference.
Used for the proper function of the website
Used for monitoring website traffic and interactions
Cookie Settings
Cookies and similar technologies are used on this website for proper function of the website, for tracking performance analytics and for marketing purposes. We and some of our third-party providers may use cookie data for various purposes. Please review the cookie settings below and choose your preference.
Strictly Necessary: Used for the proper function of the website
Performance/Analytics: Used for monitoring website traffic and interactions
The Datamarts capability opens endless possibilities for organizations to achieve their data analytics goals on the PowerBI platform. Before we look into the PowerBI Datamarts, let us take a step back and understand the meaning of a Datamart. What is PowerBI Datamarts?
Summary : Microsoft Fabric is an end-to-end Data Analytics platform designed for integration, processing, and advanced insights, while PowerBI excels in creating interactive visualisations and reports. Key Takeaways Microsoft Fabric is a full-scale data platform, while PowerBI focuses on visualising insights.
Summary: PowerBI is a business intelligence tool that transforms raw data into actionable insights. PowerBI enhances decision-making by providing interactive dashboards and reports that are accessible to both technical and non-technical users. What Is PowerBI?
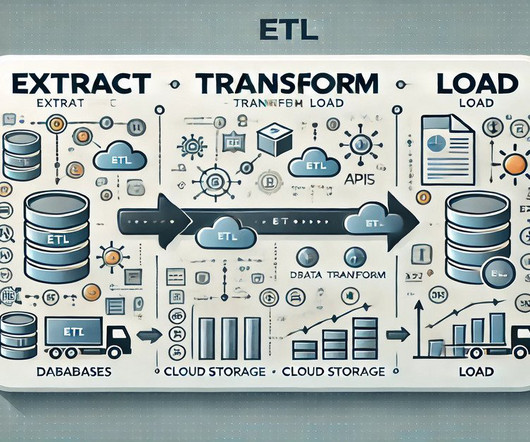
Summary: Selecting the right ETL platform is vital for efficient data integration. Introduction In today’s data-driven world, businesses rely heavily on ETL platforms to streamline data integration processes. What is ETL in Data Integration? Let’s explore some real-world applications of ETL in different sectors.
The explosion of generative AI and LLMs has redefined how businesses and developers interact with artificialintelligence. 20222024: As AI models required larger and cleaner datasets, interest in data pipelines, ETL frameworks, and real-time data processing surged.
Tools like Tableau, PowerBI, and Python libraries such as Matplotlib and Seaborn are commonly taught. Data Engineering : Building and maintaining data pipelines, ETL (Extract, Transform, Load) processes, and data warehousing. R : Often used for statistical analysis and data visualization.
AI-powered features in Excel enable users to make data-driven decisions more efficiently, saving time and effort while uncovering valuable insights hidden within large datasets. Introduction ArtificialIntelligence (AI) is revolutionising how we use Excel, making data management faster and more efficient. What is AI in Excel?
Reverse ETL tools. Business intelligence (BI) platforms. The modern data stack is also the consequence of a shift in analysis workflow, fromextract, transform, load (ETL) to extract, load, transform (ELT). A Note on the Shift from ETL to ELT. Examples of BI tools include Looker, PowerBI , and Tableau.
They create data pipelines, ETL processes, and databases to facilitate smooth data flow and storage. Together, data engineers, data scientists, and machine learning engineers form a cohesive team that drives innovation and success in data analytics and artificialintelligence. ETL Tools: Apache NiFi, Talend, etc.
One set of tools that are becoming more important in our data-driven world is BI tools. Think of Tableau, PowerBI, and QlikView. These are used to extract, transform, and load (ETL) data between different systems. Each of these creates visualizations and reports based on data stored in a database.
Data Wrangling: Data Quality, ETL, Databases, Big Data The modern data analyst is expected to be able to source and retrieve their own data for analysis. Competence in data quality, databases, and ETL (Extract, Transform, Load) are essential. As you see, there are a number of reporting platforms as expected.
Machine learning is a subset of artificialintelligence that enables computers to learn from data and improve over time without being explicitly programmed. Data Warehousing and ETL Processes What is a data warehouse, and why is it important? Explain the Extract, Transform, Load (ETL) process.
Understanding ETL (Extract, Transform, Load) processes is vital for students. Visualisation Tools Familiarity with tools such as Tableau, PowerBI, and D3.js Future Trends Exploring emerging trends in Big Data, such as the rise of edge computing, quantum computing, and advancements in artificialintelligence.
We organize all of the trending information in your field so you don't have to. Join 17,000+ users and stay up to date on the latest articles your peers are reading.
You know about us, now we want to get to know you!
Let's personalize your content
Let's get even more personalized
We recognize your account from another site in our network, please click 'Send Email' below to continue with verifying your account and setting a password.


Let's personalize your content