This site uses cookies to improve your experience. To help us insure we adhere to various privacy regulations, please select your country/region of residence. If you do not select a country, we will assume you are from the United States. Select your Cookie Settings or view our Privacy Policy and Terms of Use.
Cookie Settings
Cookies and similar technologies are used on this website for proper function of the website, for tracking performance analytics and for marketing purposes. We and some of our third-party providers may use cookie data for various purposes. Please review the cookie settings below and choose your preference.
Used for the proper function of the website
Used for monitoring website traffic and interactions
Cookie Settings
Cookies and similar technologies are used on this website for proper function of the website, for tracking performance analytics and for marketing purposes. We and some of our third-party providers may use cookie data for various purposes. Please review the cookie settings below and choose your preference.
Strictly Necessary: Used for the proper function of the website
Performance/Analytics: Used for monitoring website traffic and interactions
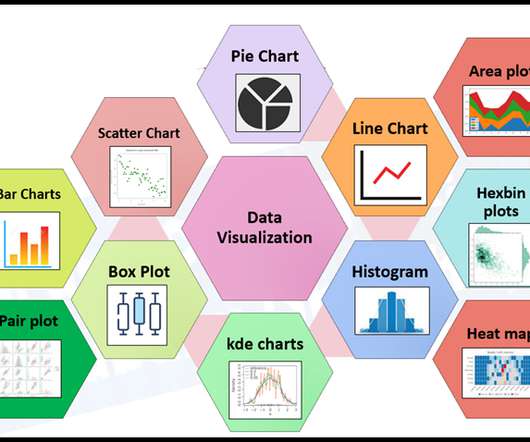
ArticleVideo Book This article was published as a part of the Data Science Blogathon DataVisualizationDataVisualization techniques involve the generation of graphical or. The post Effective DataVisualization Techniques in Data Science Using Python appeared first on Analytics Vidhya.
ArticleVideo Book This article was published as a part of the Data Science Blogathon Introduction Visualization leverages the power of data in getting insights and. The post Cyberpunk Themed Charts: Advanced DataVisualization in Python appeared first on Analytics Vidhya.
ArticleVideo Book This article was published as a part of the Data Science Blogathon Introduction DataVisualization helps to bridge the gap between numbers and. The post Plotly and cufflinks : Advanced PythonDataVisualization Libraries appeared first on Analytics Vidhya.
ArticleVideos This article was published as a part of the Data Science Blogathon. Introduction Datavisualization in python is perhaps one of the most. The post An Intuitive Guide to DataVisualization in Python appeared first on Analytics Vidhya.
ArticleVideo Book This article was published as a part of the Data Science Blogathon Like the evolution of humans, datavisualization techniques have also been. The post Lollipop Charts: Advanced DataVisualization in Python appeared first on Analytics Vidhya.
This article was published as a part of the Data Science Blogathon Image 1 Introduction I am sure many of you have read several articles around the world stating the buzz around “Machine Learning, “Data Scientist”, “DataVisualization” and so on. A report […].
ArticleVideo Book This article was published as a part of the Data Science Blogathon Introduction The twenty-first century can be regarded as the era of. The post Donut Plots : DataVisualization With Python appeared first on Analytics Vidhya.
ArticleVideo Book This article was published as a part of the Data Science Blogathon Introduction We all love exploring data. Representing data and interpreting or. The post Understanding Bar Plots in Python : Beginner’s Guide to DataVisualization appeared first on Analytics Vidhya.
Introduction In data analysis, creating visual representations is key to understanding and communicating insights effectively. One tool that shines in Python is ggplot. Built on the grammar of graphics, ggplot offers a straightforward way to make beautiful plots.
This article was published as a part of the Data Science Blogathon Overview Datavisualization is the process of finding, interpreting, and comparing data so that it can communicate more clearly complex ideas, thus making it easier to identify once analysis of logical patterns.
ArticleVideo Book This article was published as a part of the Data Science Blogathon Introduction: Seaborn is a Pythondatavisualization library based on the. The post DataVisualization Using Seaborn For Beginners appeared first on Analytics Vidhya.
ArticleVideo Book This article was published as a part of the Data Science Blogathon Introduction In applied Statistics and Machine Learning, DataVisualization is one. The post Must Known DataVisualization Techniques for Data Science appeared first on Analytics Vidhya.
This article was published as a part of the Data Science Blogathon. Introduction to Sankey Diagram for DataVisualization Very often, we are in a situation where we would have to visualize how data flows between entities.
This article was published as a part of the Data Science Blogathon. Introduction Datavisualization is the skill that helps us to interpret the data in a creative and intrusive way. Suppose we break down more aspects of datavisualization.
ArticleVideo Book This article was published as a part of the Data Science Blogathon Introduction Matplotlib is a widely used library for datavisualizations. The post Exploring Matplotlib Stylesheets For DataVisualization appeared first on Analytics Vidhya. Matplotlib.
This article was published as a part of the Data Science Blogathon. Introduction to Matplotlib Matplotlib is a widely used datavisualization library in python. This article illustrates how to display, modify and save an image using the ‘matplotlib’ library.
ArticleVideo Book This article was published as a part of the Data Science Blogathon DATAVISUALIZATION: DataVisualization is one of the parts of descriptive. The post DATAVISUALIZATION : What Is This And Why It Matters appeared first on Analytics Vidhya.
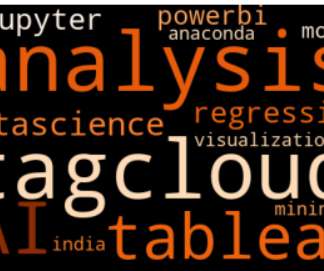
This article was published as a part of the Data Science Blogathon. Introduction I have always been in love with DataVisualization since the. The post Create a Word Cloud or Tag Cloud in Python appeared first on Analytics Vidhya.
ArticleVideo Book This article was published as a part of the Data Science Blogathon Introduction Datavisualization is the most important step in the life. The post How To Perform DataVisualization with Pandas appeared first on Analytics Vidhya.
This article was published as a part of the Data Science Blogathon. We have worked on different datavisualization libraries over the last decade. Datavisualization is the way to tell stories by curating data into a more simple plot and helps us understand and highlight the key trends in our data.
This article was published as a part of the Data Science Blogathon Introduction to Matplotlib If you are interested in data analytics or datavisualization you are at the right place to get started. The post Introduction to Matplotlib using Python for Beginners appeared first on Analytics Vidhya.
This article was published as a part of the Data Science Blogathon Image credits: Taras Bakusevych Data is the new oil we have heard it so many times. But can we visualize that data in a proper format? With the amount of data at our disposal today, the need to extract insights from it is […].
This article was published as a part of the Data Science Blogathon. Introduction Datavisualization is crucial in Data Analytics. With exploratory data analysis (EDA), we gain insights into the hidden trends and patterns in a dataset that are useful for decision-making. are […]. are […].
ArticleVideo Book This article was published as a part of the Data Science Blogathon Introduction Human beings are amongst the most creative species on this. The post 8 Charts You Must Know To Excel In The Art of DataVisualization! appeared first on Analytics Vidhya.
ArticleVideo Book This article was published as a part of the Data Science Blogathon Introduction Data is everywhere in today’s world of data, and we. The post Interactive DataVisualization Plots with Plotly and Cufflinks appeared first on Analytics Vidhya.
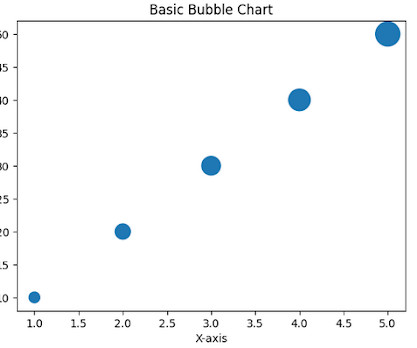
Introduction A bubble chart is a type of datavisualization that displays data points as bubbles on a two-dimensional graph. Each bubble represents a data point, and its size and color can be used to convey additional information.
This article was published as a part of the Data Science Blogathon Introduction Dash is an open-source web framework for creating analytical dashboards and datavisualizations. It helps data analysts to deploy dashboards and serve these dashboards to the main web application. appeared first on Analytics Vidhya.
Python has become the lingua franca for scientific computing and datavisualization, thanks in large part to its rich ecosystem of libraries. One such tool that has been a favourite among researchers and practitioners alike is PyLab.
ArticleVideo Book This article was published as a part of the Data Science Blogathon. Image Source Introduction We can say that datavisualization is basically. The post Visualizing Netflix Data Using Python! appeared first on Analytics Vidhya.
This article was published as a part of the Data Science Blogathon. INTRODUCTION The purpose of datavisualization is insight, not pictures ?Ben The post Exploring the Tale of Music Through DataVisualization appeared first on Analytics Vidhya. Ben Shneiderman.
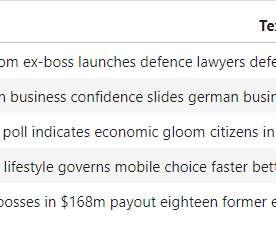
This article was published as a part of the Data Science Blogathon Introduction A news article discusses current or recent news of either general interest (i.e. A news article can include accounts of eyewitnesses to the happening event. […]. daily newspapers) or on a specific topic (i.e.
Datavisualization is the art of presenting complex information in a way that is easy to understand and analyze. With the explosion of data in today’s business world, the ability to create compelling datavisualizations has become a critical skill for anyone working with data.
This article was published as a part of the Data Science Blogathon. Introduction In DataVisualization, Dashboard is the great Graphical User Interfaces that. The post Create Interactive Dashboards with Streamlit and Python appeared first on Analytics Vidhya.
ArticleVideo Book This article was published as a part of the Data Science Blogathon Datavisualization and its importance Let’s see what does technical definition. The post DataVisualization – A Useful tool to Explore Data appeared first on Analytics Vidhya.
ArticleVideo Book This article was published as a part of the Data Science Blogathon. “Understand your customer better, with data !!” The post Customer Loyalty Program with Python appeared first on Analytics Vidhya. ” Introduction Did you.
ArticleVideo Book This article was published as a part of the Data Science Blogathon DataVisualization is a revolutionary invention that is widely used today. The post Build Treemaps in Python using Squarify appeared first on Analytics Vidhya.
This article was published as a part of the Data Science Blogathon Introduction to DataVisualization Plotting and data representation is an important part of the data-driven decision-making process and the whole data science roadmap. The visual representation of data makes understanding […].
ArticleVideo Book This article was published as a part of the Data Science Blogathon Introduction Have you ever got confused by reading those large data. The post DataVisualization Techniques You MUST Know as a Data Scientist appeared first on Analytics Vidhya.
This article was published as a part of the Data Science Blogathon Visualization plays an important role in gaining quality insights from the data. Our traditional datavisualization techniques are already playing a significant role in obtaining insights. Creating appealing […].
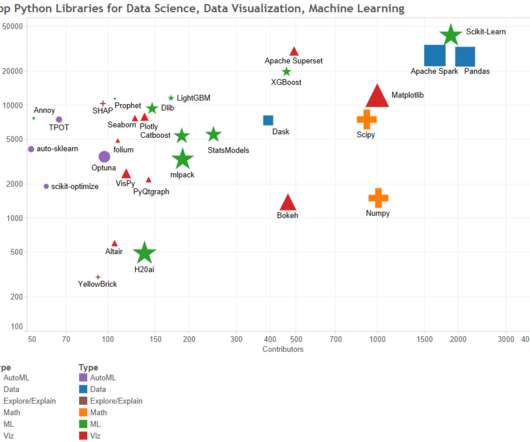
This article was published as a part of the Data Science Blogathon. Introduction As the data science community grows, Python is seen dominating the. The post The Hidden Gems of Python – Libraries that make Data Science a Cakewalk appeared first on Analytics Vidhya.
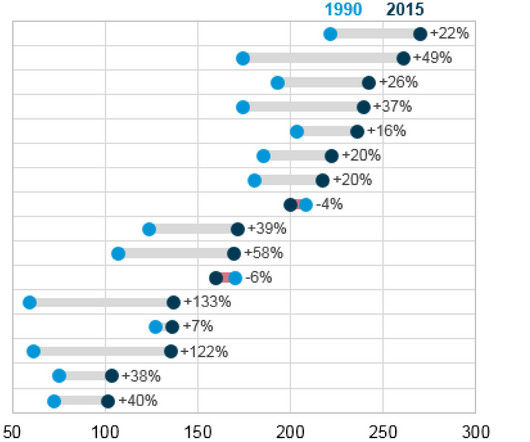
Introduction Datavisualization is an essential aspect of data analysis, as it allows us to understand and interpret complex information more easily. One popular type of visualization is the dot plot, which effectively displays categorical data and numerical values. appeared first on Analytics Vidhya.
This article was published as a part of the Data Science Blogathon. Introduction to EDA The main objective of this article is to cover the steps involved in Data pre-processing, Feature Engineering, and different stages of Exploratory Data Analysis, which is an essential step in any research analysis.
We organize all of the trending information in your field so you don't have to. Join 17,000+ users and stay up to date on the latest articles your peers are reading.
You know about us, now we want to get to know you!
Let's personalize your content
Let's get even more personalized
We recognize your account from another site in our network, please click 'Send Email' below to continue with verifying your account and setting a password.


Let's personalize your content