This site uses cookies to improve your experience. To help us insure we adhere to various privacy regulations, please select your country/region of residence. If you do not select a country, we will assume you are from the United States. Select your Cookie Settings or view our Privacy Policy and Terms of Use.
Cookie Settings
Cookies and similar technologies are used on this website for proper function of the website, for tracking performance analytics and for marketing purposes. We and some of our third-party providers may use cookie data for various purposes. Please review the cookie settings below and choose your preference.
Used for the proper function of the website
Used for monitoring website traffic and interactions
Cookie Settings
Cookies and similar technologies are used on this website for proper function of the website, for tracking performance analytics and for marketing purposes. We and some of our third-party providers may use cookie data for various purposes. Please review the cookie settings below and choose your preference.
Strictly Necessary: Used for the proper function of the website
Performance/Analytics: Used for monitoring website traffic and interactions
Introduction PowerBI uses a set of functions, operators, and constants called DAX to perform dynamic computations and analysis. One can enhance their PowerBI competency by using DAX features that help in datamodeling and reporting.
The Datamarts capability opens endless possibilities for organizations to achieve their data analytics goals on the PowerBI platform. Before we look into the PowerBI Datamarts, let us take a step back and understand the meaning of a Datamart. What is PowerBI Datamarts? What is a Datamart?
As PowerBI developers, we should be familiar with functionalities within PowerBI that allow for the implementation of various levels of data security; the most common example may be Row-Level Security (RLS). Perhaps this is because it is not a native feature readily available within PowerBI.
Summary: PowerBI is a leading data analytics platform offering advanced features like real-time analytics and collaborative capabilities. Understanding its significance is vital for aspiring PowerBI developers. Mastering PowerBI can significantly enhance career prospects, given its prevalence in the industry.
Summary: PowerBI is a business analytics tool transforming data into actionable insights. Key features include AI-powered analytics, extensive data connectivity, customisation options, and robust datamodelling. Customisable dashboards and reports enhance data presentation. Why PowerBI?
Summary: PowerBI alternatives like Tableau, Qlik Sense, and Zoho Analytics provide businesses with tailored Data Analysis and Visualisation solutions. Selecting the right alternative ensures efficient data-driven decision-making and aligns with your organisation’s goals and budget. What is PowerBI?
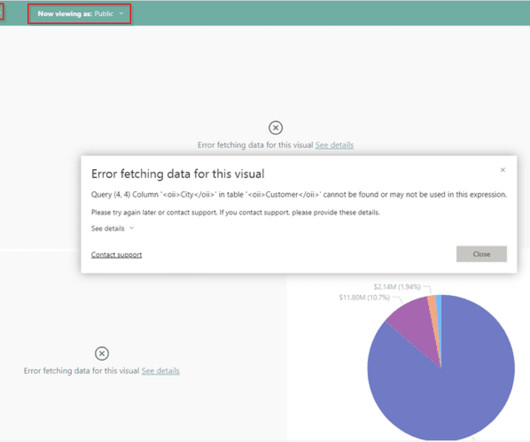
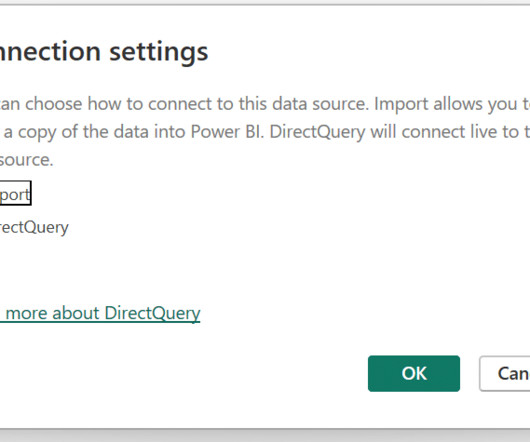
This article was originally written by Spencer Baucke and updated by Dave Ovitt. When connecting to data in PowerBI, you need to choose whether you want to use Import or Direct Query mode to connect to your data. Using the Import method, PowerBI captures and caches a snapshot of your data in PowerBI.
Here we’ve prepared a detailed outline about the future of BI, including main trends, challenges, specifics, BI-as-a-Service, and most promising BI services of today. In this article, you’ll discover: upcoming trends in business intelligence what benefits will BI provide for businesses in 2020 and on? SAP Lumira.
Effective Techniques for Data Visualization Let’s dive into the world of PowerBI to explore its features and learn some useful data visualization tips and tricks for data visualization. One of the most potent features of PowerBI is Quick Insights.
BI involves using data mining, reporting, and querying techniques to identify key business metrics and KPIs that can help companies make informed decisions. A career path in BI can be a lucrative and rewarding choice for those with interest in data analysis and problem-solving.
BI involves using data mining, reporting, and querying techniques to identify key business metrics and KPIs that can help companies make informed decisions. A career path in BI can be a lucrative and rewarding choice for those with interest in data analysis and problem-solving.
Because they are the most likely to communicate data insights, they’ll also need to know SQL, and visualization tools such as PowerBI and Tableau as well. Machine Learning Engineer Machine learning engineers will use data much differently than business analysts or data analysts. Check it out here !
The capacity to translate business needs into technical specifications is also part of this skillset, requiring a keen interest for detail and a methodical approach to handle data-related problems actively. In this article, let’s understand an explanation of how to enhance problem-solving skills as a data engineer.
Two prominent roles that play a crucial part in this data-driven landscape are Data Scientists and Data Engineers. Skills and Tools of Data Engineers Data Engineering requires a unique set of skills, including: Database Management: SQL, NoSQL, NewSQL, etc. Data Warehousing: Amazon Redshift, Google BigQuery, etc.
Although there is some truth to the developer’s (mataroa’s) article, I think it misses the root causes of many issues raised. I have mixed feelings about the article in question. Looks like the only automation platforms which can connect to all the data sources we need is VBA and Powershell. I personally don’t feel this way.
We organize all of the trending information in your field so you don't have to. Join 17,000+ users and stay up to date on the latest articles your peers are reading.
You know about us, now we want to get to know you!
Let's personalize your content
Let's get even more personalized
We recognize your account from another site in our network, please click 'Send Email' below to continue with verifying your account and setting a password.


Let's personalize your content