This site uses cookies to improve your experience. To help us insure we adhere to various privacy regulations, please select your country/region of residence. If you do not select a country, we will assume you are from the United States. Select your Cookie Settings or view our Privacy Policy and Terms of Use.
Cookie Settings
Cookies and similar technologies are used on this website for proper function of the website, for tracking performance analytics and for marketing purposes. We and some of our third-party providers may use cookie data for various purposes. Please review the cookie settings below and choose your preference.
Used for the proper function of the website
Used for monitoring website traffic and interactions
Cookie Settings
Cookies and similar technologies are used on this website for proper function of the website, for tracking performance analytics and for marketing purposes. We and some of our third-party providers may use cookie data for various purposes. Please review the cookie settings below and choose your preference.
Strictly Necessary: Used for the proper function of the website
Performance/Analytics: Used for monitoring website traffic and interactions
This article was published as a part of the Data Science Blogathon. What is PowerBI? Microsoft‘s business analytics product, PowerBI, delivers interactive data visualization BI capabilities that allow users to see and share data and insights throughout their organisation.
This article was published as a part of the Data Science Blogathon. Introduction If you’re new to PowerBI Desktop, this post is for you. You’ll learn the fundamentals of DataAnalysis Expressions (DAX) and how to apply them to common math and dataanalysis tasks in no time.
Introduction PowerBI uses a set of functions, operators, and constants called DAX to perform dynamic computations and analysis. One can enhance their PowerBI competency by using DAX features that help in data modeling and reporting.
This article was published as a part of the Data Science Blogathon. Introduction The following is an in-depth article explaining DAX which stands for DataAnalysis Expression. The post Introduction to DataAnalysis Expression (DAX) appeared first on Analytics Vidhya. It is designed to […].
This article was published as a part of the Data Science Blogathon Introduction I have been associated with Analytics Vidya from the 3rd edition of Blogathon. The post Guide For DataAnalysis: From Data Extraction to Dashboard appeared first on Analytics Vidhya.
Dataanalysis is an essential process in today’s world of business and science. It involves extracting insights from large sets of data to make informed decisions. One of the most common ways to represent a dataanalysis is through code. However, is code the best way to represent a dataanalysis?
Whether you’re a business analyst, data scientist, or marketer, the ability to communicate insights effectively is key to driving business decisions and achieving success. In this article, we’ll explore the art of data visualization and how it can be used to tell compelling stories with business analytics.
The coaching team is now counting on you to find a data-driven solution. This is where a data workflow is essential, allowing you to turn your raw data into actionable insights. In this article, well explore how that workflow covering aspects from data collection to data visualizations can tackle the real-world challenges.
Summary: PowerBI alternatives like Tableau, Qlik Sense, and Zoho Analytics provide businesses with tailored DataAnalysis and Visualisation solutions. Selecting the right alternative ensures efficient data-driven decision-making and aligns with your organisation’s goals and budget. What is PowerBI?
Summary: PowerBI is a leading data analytics platform offering advanced features like real-time analytics and collaborative capabilities. Understanding its significance is vital for aspiring PowerBI developers. Mastering PowerBI can significantly enhance career prospects, given its prevalence in the industry.
Summary: PowerBI is a business analytics tool transforming data into actionable insights. Key features include AI-powered analytics, extensive data connectivity, customisation options, and robust data modelling. Customisable dashboards and reports enhance data presentation. Why PowerBI?
The Datamarts capability opens endless possibilities for organizations to achieve their data analytics goals on the PowerBI platform. Before we look into the PowerBI Datamarts, let us take a step back and understand the meaning of a Datamart. in an enterprise data warehouse. What is PowerBI Datamarts?
Summary: Data Visualisation is crucial to ensure effective representation of insights tableau vs powerbi are two popular tools for this. This article compares Tableau and PowerBI, examining their features, pricing, and suitability for different organisations. What is PowerBI?
Below is a more detailed exploration of notable tools that leverage generative AI for data analytics, diving into their core mechanisms, features, and applications. Generative AI for Data Analytics – Top 7 Tools to Leverage 1. This capability automates much of the manual work traditionally involved in data analytics.
The problem may occur when you want to import an Excel file in SharePoint to PowerBI. When you try to get data via the Excel workbook, you have to go to the file location. Get data via the Excel workbook There is another way that I usually use. After that, paste the copied path in the URL in PowerBI.
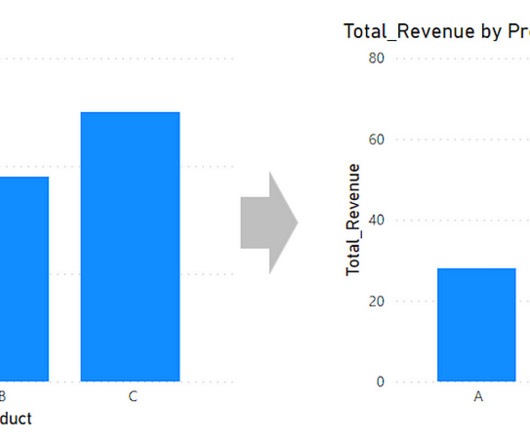
When you’re making bar charts or column charts in PowerBI (a tool for showing data visually), sometimes you want to add a special bar. So, in simpler terms, this message talks about adding a total bar to your charts in PowerBI. Hope this article is useful for you. was originally published in MLearning.ai
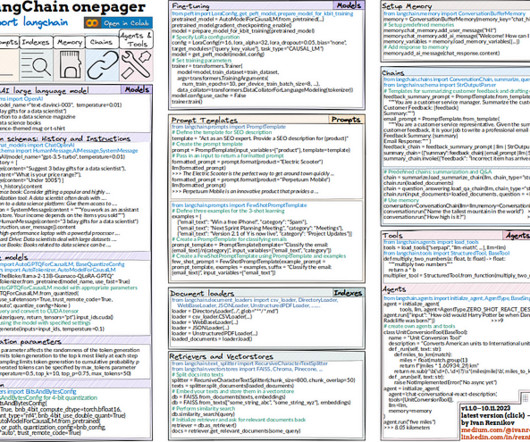
In this article, I’ll go through sections of code and describe the starter package you need to ace LangChain. These books can provide valuable insights and knowledge for a data scientist's professional development.2. Laptop: A high-performance laptop is essential for any data scientist. content)>>>1.
Introduction Power Query is a powerfuldata transformation and manipulation tool in PowerBI that allows users to extract, transform, and load data from various sources. It provides a user-friendly interface for performing complex data transformations without the need for coding.
This includes duplicate removal, missing value treatment, variable transformation, and normalization of data. Tools like Python (with pandas and NumPy), R, and ETL platforms like Apache NiFi or Talend are used for data preparation before analysis. To know more, read our article on what a Machine Learning engineer is.
For years, spreadsheet programs like Microsoft Excel, Google sheet, and more sophisticated programs like Microsoft PowerBI have been the primary tools for dataanalysis. In this article, we will share some best practices for improving your analytics with ML. Top ML approaches to improve your analytics.
Here we’ve prepared a detailed outline about the future of BI, including main trends, challenges, specifics, BI-as-a-Service, and most promising BI services of today. In this article, you’ll discover: upcoming trends in business intelligence what benefits will BI provide for businesses in 2020 and on?
Generated with Bing AI Unlocking the power of data doesn't require a data analyst certification; it's a skill accessible to anyone with data access. Grasp the Essence of Your Data Dig deeper than the surface — understand the intricacies of each column and unravel the connections between tables.
By integrating AI capabilities, Excel can now automate DataAnalysis, generate insights, and even create visualisations with minimal human intervention. AI-powered features in Excel enable users to make data-driven decisions more efficiently, saving time and effort while uncovering valuable insights hidden within large datasets.
The article will also demonstrate the impact of a skilled Business Analyst in driving organizational success. Data visualization tools like Tableau and PowerBI can be applied to inform decisions. They are also vital in defining requirements, and ensuring seamless collaboration among stakeholders.
Summary: The article explores the differences between data driven and AI driven practices. Data-driven and AI-driven approaches have become key in how businesses address challenges, seize opportunities, and shape their strategic directions. Unify Data Sources Collect data from multiple systems into one cohesive dataset.
BI involves using data mining, reporting, and querying techniques to identify key business metrics and KPIs that can help companies make informed decisions. A career path in BI can be a lucrative and rewarding choice for those with interest in dataanalysis and problem-solving. How to become a blockchain maestro?
BI involves using data mining, reporting, and querying techniques to identify key business metrics and KPIs that can help companies make informed decisions. A career path in BI can be a lucrative and rewarding choice for those with interest in dataanalysis and problem-solving. How to become a blockchain maestro?
Significance of Data Visualization Data visualization plays a crucial role in dataanalysis and decision-making for several reasons. It is not just about making data look pretty; it’s about unlocking the full potential of data to drive understanding, communication, and action.
Like Tabeau, its no-code functionality combined with AI-enhanced features can help users bring out most of their data. Microsoft PowerBI Microsoft PowerBI is almost synonymous with comprehensive business intelligence capabilities.
Ultimately, Data Blending in Tableau fosters a deeper understanding of data dynamics and drives informed strategic actions. Data Blending in Tableau Data Blending in Tableau is a sophisticated technique pivotal to modern dataanalysis endeavours. What is Data Blending in tableau with an example?
The project I did to land my business intelligence internship — CAR BRAND SEARCH ETL PROCESS WITH PYTHON, POSTGRESQL & POWERBI 1. The article will be presented in 5 sections, which will be described as follows: Section 1: Brief description that acts as the motivating foundation of this research. using Anconda Environment.
We looked at over 25,000 job descriptions, and these are the data analytics platforms, tools, and skills that employers are looking for in 2023. Excel is the second most sought-after tool in our chart as you’ll see below as it’s still an industry standard for data management and analytics.
This article aims to guide you through the intricacies of Data Analyst interviews, offering valuable insights with a comprehensive list of top questions. Additionally, we’ve got your back if you consider enrolling in the best data analytics courses. Case Study Questions Imagine you have a dataset of customer transactions.
To meet this demand, free Data Science courses offer accessible entry points for learners worldwide. With these courses, anyone can develop essential skills in Python, Machine Learning, and Data Visualisation without financial barriers. A well-rounded curriculum prepares you for practical applications in Data Science.
Two prominent roles that play a crucial part in this data-driven landscape are Data Scientists and Data Engineers. At the core of Data Science lies the art of transforming raw data into actionable information that can guide strategic decisions. Data Visualization: Matplotlib, Seaborn, Tableau, etc.
We are living in a world where data drives decisions. Data manipulation in Data Science is the fundamental process in dataanalysis. The data professionals deploy different techniques and operations to derive valuable information from the raw and unstructured data.
Data refers to raw, unprocessed facts, while information has been organised and interpreted to provide meaning. Understanding the difference between data and information is crucial for making informed decisions in both personal and professional contexts. Data processing and analysis play crucial roles in different fields.
This article aims to guide readers in selecting the best AI and Machine Learning Courses to enhance their careers. hours of on-demand video 5 coding exercises 40 articles and 9 downloadable resources Full access on mobile and TV Data Science Job Guarantee Program by Pickl.AI Ideal starting point for aspiring Data Scientists.
Organisations leverage analytical capabilities to transform raw data into actionable insights, driving informed decision-making and fostering innovation. This article aims to explore key analytical capabilities that contribute to business success, highlighting their significance and the benefits they bring.
Summary: Data visualization transforms complex datasets into easily understandable visuals, facilitating better decision-making and communication. While it enhances DataAnalysis and engagement, challenges such as misinterpretation, oversimplification, and accessibility issues can arise.
We organize all of the trending information in your field so you don't have to. Join 17,000+ users and stay up to date on the latest articles your peers are reading.
You know about us, now we want to get to know you!
Let's personalize your content
Let's get even more personalized
We recognize your account from another site in our network, please click 'Send Email' below to continue with verifying your account and setting a password.


Let's personalize your content