This site uses cookies to improve your experience. To help us insure we adhere to various privacy regulations, please select your country/region of residence. If you do not select a country, we will assume you are from the United States. Select your Cookie Settings or view our Privacy Policy and Terms of Use.
Cookie Settings
Cookies and similar technologies are used on this website for proper function of the website, for tracking performance analytics and for marketing purposes. We and some of our third-party providers may use cookie data for various purposes. Please review the cookie settings below and choose your preference.
Used for the proper function of the website
Used for monitoring website traffic and interactions
Cookie Settings
Cookies and similar technologies are used on this website for proper function of the website, for tracking performance analytics and for marketing purposes. We and some of our third-party providers may use cookie data for various purposes. Please review the cookie settings below and choose your preference.
Strictly Necessary: Used for the proper function of the website
Performance/Analytics: Used for monitoring website traffic and interactions
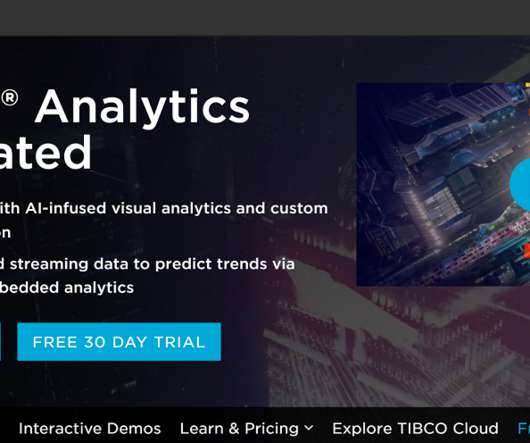
This article was published as a part of the Data Science Blogathon Introduction This article will introduce you to the Spotfire BusinessIntelligence tool for creating interactive visualization, performing data analysis, and data science. The latest version is Spotfire 11.
ArticleVideo Book This article was published as a part of the Data Science Blogathon. This article helps in understanding the importance of data. The post Guide to DataVisualization and Insights appeared first on Analytics Vidhya.
ArticleVideo Book This article was published as a part of the Data Science Blogathon. Introduction Datavisualization is the practice of translating data into. The post Top 10 DataVisualization Tools appeared first on Analytics Vidhya.
This article was published as a part of the Data Science Blogathon. Introduction Tableau is a datavisualization tool created in Salesforce that allows users to connect to any database, like SQL or MongoDB, and interact freely.
This article was published as a part of the Data Science Blogathon. Introduction In this article, we will explore one of Microsoft’s proprietary products, “PowerBI”, in-depth. PowerBI is used for Businessintelligence.
This article was published as a part of the Data Science Blogathon. This self-service businessintelligence tool is the latest and greatest in the data-driven industry. It eased the workaround for attaining data from several sources and consolidating it into one management […].
If the work of a human’s mind can be somehow represented, interactive datavisualization is the closest form of such representation right before pure art. So, what is Interactive datavisualization and how are they driven by modern interactive datavisualization tools? Check out this article.
The issue is many organizations have segregated data environments. Each department often has its own data management platform that may not integrate with other […] The post Data Concierge: Driving BusinessIntelligence Collaboration appeared first on DATAVERSITY.
. – Data virtualization: Aims to provide a cohesive data view while obscuring specifics about the data’s location and format. Sompo Asia’s approach to agile data analytics and its impact on businessintelligence. Steps towards enhancing datavisualization literacy in organizations.
ArticleVideo Book This article was published as a part of the Data Science Blogathon. Introduction DataVisualization is a graphical way to represent data by. The post Make Your Tableau Visuals More Effective – Tips And Tricks appeared first on Analytics Vidhya.
This article was published as a part of the Data Science Blogathon. Creating a chart or visual in Tableau is. The post 5 Tableau Tips for Designing a Tidy and Impactful Visualization appeared first on Analytics Vidhya. Introduction to Tableau Tips!
This article was published as a part of the Data Science Blogathon. With QlikView, you can analyze and visualizedata and their relationships and use these analyzes to make decisions. It Supports various data sources, including […].
Businessintelligence (BI) tools transform the unprocessed data into meaningful and actionable insight. BI tools analyze the data and convert them […]. The post Important Features of Top BusinessIntelligence Tools appeared first on DATAVERSITY.
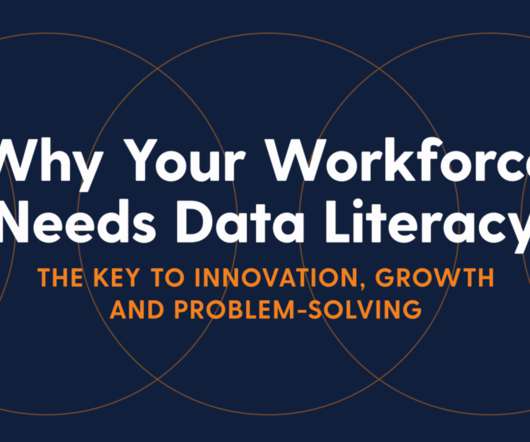
Graphs, charts with colors, lines and shapes can often tell a story and communicate issues, challenges and opportunities in a business environment. According to Forbes, Almost eighty-thousand scientific studies attest that visual images promote retention.
ArticleVideo Book This article was published as a part of the Data Science Blogathon. Microsoft Power BI is a collection of apps, software services, The post Rise of Microsoft Power BI as a Data Analytics powerhouse appeared first on Analytics Vidhya.
Introduction This article will introduce the concept of data modeling, a crucial process that outlines how data is stored, organized, and accessed within a database or data system. It involves converting real-world business needs into a logical and structured format that can be realized in a database or data warehouse.
In today’s fast-paced business landscape, companies need to stay ahead of the curve to remain competitive. Businessintelligence (BI) has emerged as a key solution to help companies gain insights into their operations and market trends. What is businessintelligence?
In today’s fast-paced business landscape, companies need to stay ahead of the curve to remain competitive. Businessintelligence (BI) has emerged as a key solution to help companies gain insights into their operations and market trends. What is businessintelligence?
ArticleVideo Book This article was published as a part of the Data Science Blogathon. The post Learn how to get insights from Azure SQL Database: A sample data analytics project using Global Peace Index data appeared first on Analytics Vidhya. Introduction Are you passionate about the empirical investigation to find.
While machine learning frameworks and platforms like PyTorch, TensorFlow, and scikit-learn can perform data exploration well, it’s not their primary intent. There are also plenty of datavisualization libraries available that can handle exploration like Plotly, matplotlib, D3, Apache ECharts, Bokeh, etc.
In the digital era, datavisualization stands as an indispensable tool in the realm of businessintelligence. It represents the graphical display of data and information, transforming complex datasets into intuitive and understandable visuals.
Typical businessintelligence implementations allow business users to easily consume data specific to their goals and daily tasks. The ability to analyze both past and present events unlocks information about the current state and is essential for remaining competitive in today’s data-forward market.
One of the many ways that data analytics is shaping the business world has been with advances in businessintelligence. The market for businessintelligence technology is projected to exceed $35 billion by 2028. What is BusinessIntelligence? Many companies are following her direction.
In the world of datavisualization , the ability to produce material that can speak to your audience, regardless of their technical expertise, is an ever-important factor to consider. Tableau Public Tableau Public , a powerful datavisualization software, empowers users to create interactive and shareable dashboards with ease.
However, presenting data is a crucial exercise that requires a lot of creativity to ensure that every team member can grasp the meaning of the content. Many people get confused about how to find valuable insights from a large volume of data in a spreadsheet. That’s […].
I started my career as a data analyst in a controlling department immediately following my graduation from the University of West Bohemia; I now work as a data scientist providing consultancy services for a range of different fields. The data analysis itself is the fun part. […].
Data mining is a fascinating field that blends statistical techniques, machine learning, and database systems to reveal insights hidden within vast amounts of data. Businesses across various sectors are leveraging data mining to gain a competitive edge, improve decision-making, and optimize operations.
Presenting data with colors […] The post Smart DataVisualization Tells a Story Your Users Will Love appeared first on DATAVERSITY. The answer is simple. Our brains grasp and respond to images, colors, and patterns and more quickly assimilate information.
The purpose of datavisualization is to facilitate the perception of information arrays and to identify patterns that are difficult to notice in a text table. To make a useful and powerful infographic, you need to follow the laws and regulations of datavisualization.
You can use custom businessintelligence (BI) dashboards. These offer a tailored approach to data analysis. They are exceptional datavisualization solutions. These businesses need to understand how to use them to improve data analysis. It presents information in a relevant way for the same reason.
We have previously written about the benefits of datavisualization, including its advantages with content marketing. We felt we were overdue for another article on this topic, so we wanted to talk about a particular type of technology that can be beneficial – box plots.
Data scientists try multiple models, evaluate their performance, and fine-tune some parameters to get better accuracy. DataVisualization and Interpretation To make the data understandable to stakeholders, visualizations are created in the form of charts, graphs, and dashboards.
The project I did to land my businessintelligence internship — CAR BRAND SEARCH ETL PROCESS WITH PYTHON, POSTGRESQL & POWER BI 1. The article will be presented in 5 sections, which will be described as follows: Section 1: Brief description that acts as the motivating foundation of this research.
BigQuery operation principles Businessintelligence projects presume collecting information from different sources into one database. Then, an analyst prepares them for reporting (via datavisualization tools like Google Data Studio). The BigQuery tool was designed to be the centerpiece of data analysis.
What is businessintelligence democratization? Put simply, BI democratization is the open access to businessintelligence and augmented analytics tools to enable analysis and understanding of the data within the enterprise systems. Who gets access to the data? The simple answer is: everyone.
These tools provide scalability and ease of use, making them ideal for enterprises that require robust data processing capabilities. DataVisualization and BusinessIntelligence Tableau Tableau has revolutionized datavisualization, offering a user-friendly platform for creating interactive dashboards and reports.
Augmented Analytics — Where Do You Fit in at the Intersection of Analytics and BusinessIntelligence? Datavisualization is a critical way for anyone to turn endless rows of data into easy-to-understand results through dynamic and understandable visuals.
Programming for Data Science enables Data Scientists to analyze vast amounts of data and extract meaningful information. There are different programming languages and in this article, we will explore 8 programming languages that play a crucial role in the realm of Data Science.
Editor's note: This article originally appeared in Forbes. Organizations that rely on data analysis to make decisions have a significant competitive advantage in overcoming challenges and planning for the future. The best data communities build enthusiasm through programs like internal competitions and lunch-and-learns.
That’s where data science comes into our lives, the interdisciplinary field that has emerged as the backbone of the modern information era. That’s why, in this article, we’ll explore why data science is not only a good career choice but also a thriving and promising one. Is data science a good career?
Improved Analytics Gut feelings are great, but data-driven insights are better. AI-powered analytics will take your businessintelligence to the next level. Conclusion These are just a few ways that an organization can benefit from using artificial intelligence in 2024. Tickets are currently 60% off, so don’t delay!
7 Techniques To Maximize Productivity with ChatGPT In this article, we will explore 7 techniques for using ChatGPT to boost productivity, from setting goals and managing time to brainstorming and language learning. Let’s take a look at a few practical use cases for large language models and how they can shape your AI endeavors too.
Editor's note: This article originally appeared in Forbes. Organizations that rely on data analysis to make decisions have a significant competitive advantage in overcoming challenges and planning for the future. The best data communities build enthusiasm through programs like internal competitions and lunch-and-learns.
We organize all of the trending information in your field so you don't have to. Join 17,000+ users and stay up to date on the latest articles your peers are reading.
You know about us, now we want to get to know you!
Let's personalize your content
Let's get even more personalized
We recognize your account from another site in our network, please click 'Send Email' below to continue with verifying your account and setting a password.


Let's personalize your content