This site uses cookies to improve your experience. To help us insure we adhere to various privacy regulations, please select your country/region of residence. If you do not select a country, we will assume you are from the United States. Select your Cookie Settings or view our Privacy Policy and Terms of Use.
Cookie Settings
Cookies and similar technologies are used on this website for proper function of the website, for tracking performance analytics and for marketing purposes. We and some of our third-party providers may use cookie data for various purposes. Please review the cookie settings below and choose your preference.
Used for the proper function of the website
Used for monitoring website traffic and interactions
Cookie Settings
Cookies and similar technologies are used on this website for proper function of the website, for tracking performance analytics and for marketing purposes. We and some of our third-party providers may use cookie data for various purposes. Please review the cookie settings below and choose your preference.
Strictly Necessary: Used for the proper function of the website
Performance/Analytics: Used for monitoring website traffic and interactions
Descriptive analytics is a fascinating area of data analytics that allows businesses to look back and glean insights from their historical data. This foundational aspect of data analytics is essential for any organization seeking to improve its performance and stay competitive. What is descriptive analytics?
Generative AI (GenAI) is stepping in to change the game by making data analytics accessible to everyone. As data keeps growing, tools powered by Generative AI for data analytics are helping businesses and individuals tap into this potential, making decisions faster and smarter.
Business analytics is a powerful enabler for organizations seeking to harness the quintessence of information to optimize performance and drive strategic initiatives. What is business analytics? Types of business analytics Business analytics can be categorized into several types, each serving distinct purposes.
BI provides real-time data analysis and performance monitoring, while Data Science enables a deep dive into dependencies in data with data mining and automates decision making with predictiveanalytics and personalized customer experiences. The data models are seen as data products with defined value, costs and ownership.
Did you know that 53% of companies use data analytics technology ? Machine Learning Helps Companies Get More Value Out of Analytics. There are a lot of benefits of using analytics to help run a business. You will get even more value out of analytics if you leverage machine learning at the same time. Predictiveanalytics.
Summary : Microsoft Fabric is an end-to-end Data Analytics platform designed for integration, processing, and advanced insights, while PowerBI excels in creating interactive visualisations and reports. Key Takeaways Microsoft Fabric is a full-scale data platform, while PowerBI focuses on visualising insights.
Summary: PowerBI is a business intelligence tool that transforms raw data into actionable insights. PowerBI enhances decision-making by providing interactive dashboards and reports that are accessible to both technical and non-technical users. What Is PowerBI?
It has revolutionized the way businesses approach data analytics by providing cost-effective and customizable solutions that are tailored to specific business needs. Paid BI software often comes with dedicated technical support, which can help businesses troubleshoot any issues and ensure that the software is running smoothly.
Summary: PowerBI alternatives like Tableau, Qlik Sense, and Zoho Analytics provide businesses with tailored Data Analysis and Visualisation solutions. Introduction PowerBI has become one of the most popular business intelligence (BI) tools, offering powerful Data Visualisation, reporting, and decision-making features.
Summary: This blog dives into the most promising PowerBI projects, exploring advanced data visualization, AI integration, IoT & blockchain analytics, and emerging technologies. Introduction to PowerBI Project s The world of Data Analysis is constantly evolving, and PowerBI stands at the forefront of this transformation.
Though you may encounter the terms “data science” and “data analytics” being used interchangeably in conversations or online, they refer to two distinctly different concepts. Meanwhile, data analytics is the act of examining datasets to extract value and find answers to specific questions.
Mito is the powerhouse of your data analytics workflow. We built Mito to be the first analytics tool that’s easy to use, super powerful, and designed to keep your workflow yours forever. When it comes to data analytics , not much is easier to use than a spreadsheet. Great Power. Or something. Easy Smeasy.
We’re well past the point of realization that big data and advanced analytics solutions are valuable — just about everyone knows this by now. IDC predicts that if our digital universe or total data content were represented by tablets, then by 2020 they would stretch all the way to the moon over six times.
More and more often, businesses are using data to drive their decisions — which makes cutting-edge analytics and business intelligence strategies one of the best advantages a company can have. Predictive Business Analytics. The Growing BI Analyst Shortage.
By presenting data visually, organisations can communicate insights more clearly and drive strategic decisions based on real-time analytics. Supports predictiveanalytics to anticipate market trends and behaviours. Social Media Analytics Platforms like Facebook use Big Data visualization to analyse user engagement metrics.
The Event Log Data Model for Process Mining Process Mining as an analytical system can very well be imagined as an iceberg. An object-centric data model is a big deal because it offers the opportunity for a holistic approach and as a database a single source of truth for Process Mining but also for other types of analytical applications.
Example: For a project to optimize supply chain operations, the scope might include creating dashboards for inventory tracking but exclude advanced predictiveanalytics in the first phase. Actionable steps: Create mockups : Use tools like Figma or PowerBI to prototype dashboards and reports.
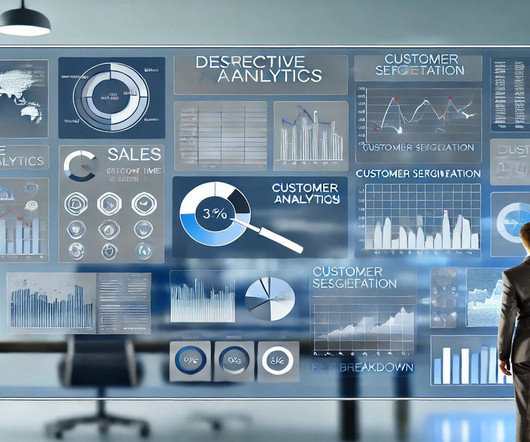
Summary: Descriptive Analytics tools transform historical data into visual reports, helping businesses identify trends and improve decision-making. Popular tools like PowerBI, Tableau, and Google Data Studio offer unique features for Data Analysis. What is Descriptive Analytics?
Decision intelligence goes beyond traditional analytics by incorporating behavioral science to understand and model human decision-making Behavioral science integration Decision intelligence incorporates principles from behavioral science to understand and model human decision-making processes.
Summary: Analytical capabilities are essential for transforming data into actionable insights. Businesses can improve decision-making, operational efficiency, and customer understanding by leveraging various analytics types, driving sustained growth and innovation.
Visualization libraries available in Python such as Matplotlib and Seaborn, and tools like Tableau and PowerBI become crucial to telling stories that lead to insights. Their job is to ensure that data is made available, trusted, and organizedall of which are required for any analytics or machine-learning task.
Summary: The difference between Data Science and Data Analytics lies in their approachData Science uses AI and Machine Learning for predictions, while Data Analytics focuses on analysing past trends. Data Science requires advanced coding, whereas Data Analytics relies on statistical methods. What is Data Analytics?
Using tools like PowerBI, Tableau, and Grafana, organisations can analyse real-time IoT data, optimise operations, and enhance decision-making while addressing security, scalability, and visualisation challenges. Real-time dashboards and analytics enhance industry monitoring, efficiency, and predictive capabilities.
According to a report by Gartner, organizations that utilize BI tools can improve their operational efficiency and gain competitive advantages over rivals. Furthermore, a study indicated that 71% of organisations consider Data Analytics a critical factor for enhancing their business performance.
PowerBI Integration It brings real-time analytics and advanced reporting capabilities to Excel. PowerBI’s AI features complement Excel’s functionalities by enabling more sophisticated data visualisations and interactive dashboards. Integrate with PowerBI Integrate Excel with PowerBI for advanced analytics.
Expertise in tools like PowerBI, SQL, and Python is crucial. They leverage advanced analytics tools and software to analyse performance metrics, monitor trends, and create detailed reports. Effective communication helps translate analytical findings into actionable business strategies.
Key components include data storage solutions, processing frameworks, analytics tools, and governance practices. Analytics tools help convert raw data into actionable insights for businesses. Real-time analytics are becoming increasingly important for businesses that need to respond quickly to market changes. What is Big Data?
Key components include data storage solutions, processing frameworks, analytics tools, and governance practices. Analytics tools help convert raw data into actionable insights for businesses. Real-time analytics are becoming increasingly important for businesses that need to respond quickly to market changes. What is Big Data?
Summary: The future of Data Science is shaped by emerging trends such as advanced AI and Machine Learning, augmented analytics, and automated processes. Data privacy regulations will shape how organisations handle sensitive information in analytics. Continuous learning and adaptation will be essential for data professionals.
There are three main types, each serving a distinct purpose: Descriptive Analytics (Business Intelligence): This focuses on understanding what happened. Prescriptive Analytics (Decision Science): This goes beyond prediction, using data to recommend specific actions. ” or “What are our customer demographics?”
Here are steps you can follow to pursue a career as a BI Developer: Acquire a solid foundation in data and analytics: Start by building a strong understanding of data concepts, relational databases, SQL (Structured Query Language), and data modeling. Stay curious and committed to continuous learning.
A survey by Dresner Advisory Services found that 53% of organizations consider BI a critical component for business success. Research indicates that companies utilizing advanced analytics are 5 times more likely to make faster decisions than their competitors. They are useful for big data analytics where flexibility is needed.
Another benefit of Fivetran is that data is normalized when it’s brought in, so it’s easy to create analytics-ready tables for your data team to work with. Step 2: Analyze the Data Once you have centralized your data, use a business intelligence tool like Sigma Computing , PowerBI , Tableau , or another to craft analytics dashboards.
Predictiveanalytics and modeling: With Tableau’s integration with statistical tools, you can build predictive models using techniques like regression, classification, clustering, and time series analysis. Accordingly, Tableau Data Scientist salary is generally more than those experts having specialisation in PowerBI.
Scikit-learn also earns a top spot thanks to its success with predictiveanalytics and general machine learning. Kafka remains the go-to for real-time analytics and streaming. Algorithms Algorithms form the backbone of data science, enabling models to process data, identify patterns, and make predictions.
The Power of Machine Learning and AI in Data Science Machine Learning (ML) and AI are integral components of Data Science that enable systems to learn from data without explicit programming. Example: IBM Watson Health uses AI-poweredanalytics for cancer treatment recommendations.
By harnessing the power of Data Science, healthcare professionals can unlock the hidden potential within this vast ocean of information, leading to a paradigm shift in patient care. What is Healthcare Analytics? Operational Analytics: Analyzing healthcare processes to identify inefficiencies and improve operational efficiency.
Moreover, its ability to integrate seamlessly with Microsoft tools (Office 365, Teams, PowerBI) and third-party applications makes collaboration and data access much easier. The platforms analytics and reporting tools provide clear, actionable insights to support better decision-making.
We organize all of the trending information in your field so you don't have to. Join 17,000+ users and stay up to date on the latest articles your peers are reading.
You know about us, now we want to get to know you!
Let's personalize your content
Let's get even more personalized
We recognize your account from another site in our network, please click 'Send Email' below to continue with verifying your account and setting a password.


Let's personalize your content