This site uses cookies to improve your experience. To help us insure we adhere to various privacy regulations, please select your country/region of residence. If you do not select a country, we will assume you are from the United States. Select your Cookie Settings or view our Privacy Policy and Terms of Use.
Cookie Settings
Cookies and similar technologies are used on this website for proper function of the website, for tracking performance analytics and for marketing purposes. We and some of our third-party providers may use cookie data for various purposes. Please review the cookie settings below and choose your preference.
Used for the proper function of the website
Used for monitoring website traffic and interactions
Cookie Settings
Cookies and similar technologies are used on this website for proper function of the website, for tracking performance analytics and for marketing purposes. We and some of our third-party providers may use cookie data for various purposes. Please review the cookie settings below and choose your preference.
Strictly Necessary: Used for the proper function of the website
Performance/Analytics: Used for monitoring website traffic and interactions
In that case, we invite you to check out DataHour, a series of webinars led by experts in the field. Through these webinars, you’ll gain hands-on experience, deepen your understanding […] The post Join DataHour Sessions With Industry Experts appeared first on Analytics Vidhya.
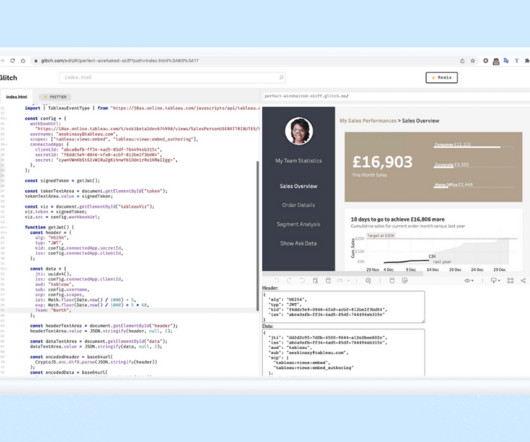
Sharon Liao Senior Product Manager, Tableau Bronwen Boyd March 30, 2023 - 5:29am April 4, 2023 As companies increasingly rely on dataanalytics to make informed decisions and gain a competitive edge, the challenge of presenting relevant and secure data to end users has become even more critical. Let’s dig into some examples.
A new online conference focused on cloud data technologies is coming this fall. It is not just a conference or webinar, it will be an interactive online platform. The focus of the event is data in the cloud (migrating, storing and machine learning). You can pre-register for the conference now.
That’s why using location to analyze your business data just makes sense. Leveraging datavisualizations can reveal hidden patterns and relationships that move users from “what happened” to “how,” “why,” and “in what context.” That’s what makes spatial analytics so important. What Is Spatial Analytics?
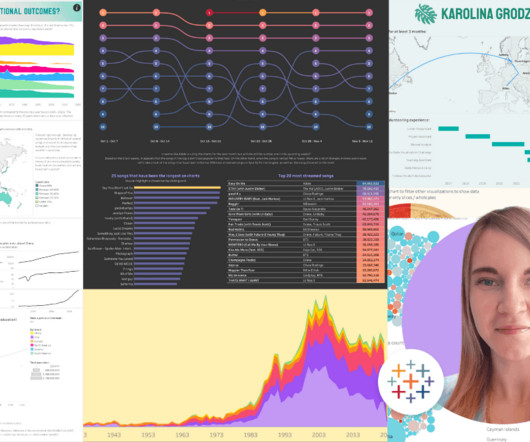
Countless hours vizzing, a standout Tableau Public profile , and a graduate degree later, Karolina reflects on her data journey and what led her to her current role as a Business Intelligence Analyst at Schneider Electric. I already had some interest in datavisualization, I just didn't know where to start.
Are you an aspiring data scientist , or just want to understand the benefits of integrating data catalogs with visualization tools? In today’s ever-growing world of data, having an easy way to gain insights quickly is essential. It helps them effectively capture, store, manage, and share data assets.
ODSC Highlights Exploring Open-Source Innovations: 13 Companies Offering Cutting-Edge Solutions These companies offer unique open-source AI solutions covering everything from datavisualization to AI-powered data labeling andmore. What Can You Do With a Free ODSC East ExpoPass? Register by Friday for 30%off!
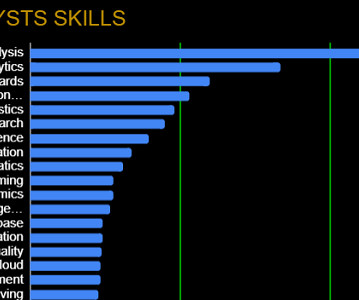
Top DataAnalytics Skills and Platforms for 2023, PyTorch 2.0 Released, and 5 Huge Data Science Career Mistakes Top DataAnalytics Skills and Platforms for 2023 We looked at over 25,000 job descriptions, and these are the dataanalytics platforms, tools, and skills that employers are looking for in 2023.
These events are more than just webinars and presentations; they’re a vibrant marketplace of ideas, where professionals from various facets of AI converge, explore collaborations, and even stumble upon new career paths. The event is hosted by Data Science Dojo and will be held on September 27, 2023.
Are you an aspiring data scientist , or just want to understand the benefits of integrating data catalogs with visualization tools? In today’s ever-growing world of data, having an easy way to gain insights quickly is essential. It helps them effectively capture, store, manage, and share data assets.
Sharon Liao Senior Product Manager, Tableau Bronwen Boyd March 30, 2023 - 5:29am April 4, 2023 As companies increasingly rely on dataanalytics to make informed decisions and gain a competitive edge, the challenge of presenting relevant and secure data to end users has become even more critical. Let’s dig into some examples.
ODSC West Call for Volunteers October 30th to November 2nd Our Volunteer program is a great way to get involved in ODSC — one of the world’s largest conferences and communities of artificial intelligence and data science experts.
Now powered by Tableau, Genie brings that trusted, up-to-the-moment customer data to life by layering on visual, explorable, and actionable analytics and insights. . Cut costs by consolidating data warehouse investments. Take action with AI-powered insights in the flow of work. How do Genie and Tableau work together? .
Now powered by Tableau, Genie brings that trusted, up-to-the-moment customer data to life by layering on visual, explorable, and actionable analytics and insights. . Cut costs by consolidating data warehouse investments. Take action with AI-powered insights in the flow of work. How do Genie and Tableau work together? .
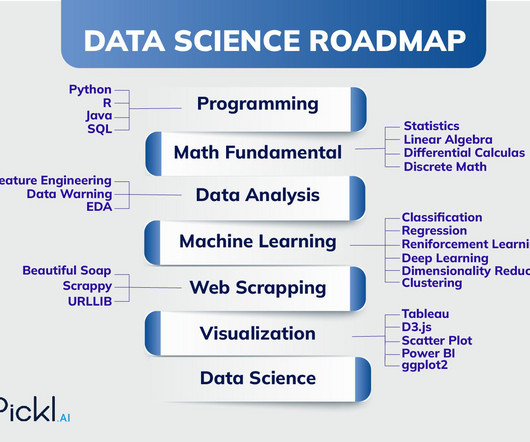
Embarking on a journey in Data Science requires staying abreast of the latest trends, techniques, and innovations. Data Science articles for beginners are a great way to stay ahead of the curve and keep tabs on the new developments. It provides news, tutorials, and resources for data scientists and analysts. URL: Pickl.AI
Embarking on a journey in Data Science requires staying abreast of the latest trends, techniques, and innovations. Data Science articles for beginners are a great way to stay ahead of the curve and keep tabs on the new developments. It provides news, tutorials, and resources for data scientists and analysts. URL: Pickl.AI
It is the process of converting raw data into relevant and practical knowledge to help evaluate the performance of businesses, discover trends, and make well-informed choices. Data gathering, data integration, data modelling, analysis of information, and datavisualization are all part of intelligence for businesses.
The challenge to understand hidden relationships and uncover actionable insights from data is universal, across countless datavisualization use cases. In this blog post, we focus on seven of the most popular: Why visualizedata as a graph? Datavisualization makes it easy for us to identify trends and outliers.
A Beginner’s Guide to Build Your Own LLM-Based Solutions With the KNIME AI Extension In this blog, learn how you can build your own LLM-based solutions using KNIME, a low-code/no-code analytics platform. Register now for 50% off!
This approach is “for the people who just need to solve a problem—get in and get out,” said Ravi Mistry, one of about three dozen Tableau Zen Masters , professionals selected by Tableau who are masters of the Tableau end-to-end analytics platform and now teach others how to use it. of employees are confident in their data literacy skills.
It combines techniques from mathematics, statistics, computer science, and domain expertise to analyze data, draw conclusions, and forecast future trends. Data scientists use a combination of programming languages (Python, R, etc.), Participate in online courses, webinars, and workshops to keep your skills relevant and in demand.
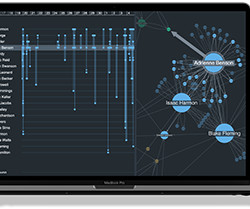
Datavisualization is the quickest and most powerful way to give organizations a deeper understanding of their connected data. Our visualization toolkits have been used in countless critical use cases including fraud detection, law enforcement and security, cyber security, infrastructure management and regulatory compliance.
Streamlining Government Regulatory Responses with Natural Language Processing, GenAI, and Text Analytics Through text analytics, linguistic rules are used to identify and refine how each unique statement aligns with a different aspect of the regulation. How can big dataanalytics help?
As the world’s first real-time CRM, Salesforce Customer 360 and Data Cloud provide your entire organization with a single, up-to-the-minute view of your customer across any cloud. Data Cloud for Tableau brings that trusted, up-to-the-moment customer data to life by layering on visual, explorable, and actionable analytics and insights.
Moreover, with the oozing opportunities in Data Science job roles, transitioning your career from Computer Science to Data Science can be quite interesting. A degree in Computer Science prepares you to become a professional who is tech-savvy and has proficiency in coding and analytical thinking.
It covers essential topics such as SQL queries, datavisualization, statistical analysis, machine learning concepts, and data manipulation techniques. This article aims to guide you through the intricacies of Data Analyst interviews, offering valuable insights with a comprehensive list of top questions.
Introduction Data Science is revolutionising industries by extracting valuable insights from complex data sets, driving innovation, and enhancing decision-making. This roadmap aims to guide aspiring Azure Data Scientists through the essential steps to build a successful career.
Programming: A BI professional should have knowledge of programming languages such as SQL, Python, or R, and be able to use them to extract data and perform advanced analytics. However, BI careers offer a competitive salary and a wide range of opportunities for growth and advancement.
Programming: A BI professional should have knowledge of programming languages such as SQL, Python, or R, and be able to use them to extract data and perform advanced analytics. However, BI careers offer a competitive salary and a wide range of opportunities for growth and advancement.
In a digital era fueled by data-driven decision-making, the role of a Data Scientist has become pivotal. With the 650% jump in the implementation of analytics, the role of Data Scientists is becoming profound. Companies are looking forward to hiring crème de la crème Data Scientists.
This approach is “for the people who just need to solve a problem—get in and get out,” said Ravi Mistry, one of about three dozen Tableau Zen Masters , professionals selected by Tableau who are masters of the Tableau end-to-end analytics platform and now teach others how to use it. of employees are confident in their data literacy skills.
Each image and animation demonstrates what you can achieve with our datavisualization toolkits. It exposes hierarchies : Visualizing transactions paints a clear picture of control structures and rankings between businesses, shareholder groups or account holders. Webinar: COMINT analysis in 5 steps 5.
offers its Data Science course with Job Guarantee , a 5-month online program with 100% placement guaranteed and certification. Additionally, it also offers you with one-month internship opportunity, with its parent company, TransOrg Analytics.
Patterns in the Noise: Visualizing the Hidden Structures of Unstructured Documents Discover how Docling unlocks structure in complex documentspreserving layout, context, and formatting to supercharge AI workflows, from RAG to LLM training.
We organize all of the trending information in your field so you don't have to. Join 17,000+ users and stay up to date on the latest articles your peers are reading.
You know about us, now we want to get to know you!
Let's personalize your content
Let's get even more personalized
We recognize your account from another site in our network, please click 'Send Email' below to continue with verifying your account and setting a password.


Let's personalize your content