This site uses cookies to improve your experience. To help us insure we adhere to various privacy regulations, please select your country/region of residence. If you do not select a country, we will assume you are from the United States. Select your Cookie Settings or view our Privacy Policy and Terms of Use.
Cookie Settings
Cookies and similar technologies are used on this website for proper function of the website, for tracking performance analytics and for marketing purposes. We and some of our third-party providers may use cookie data for various purposes. Please review the cookie settings below and choose your preference.
Used for the proper function of the website
Used for monitoring website traffic and interactions
Cookie Settings
Cookies and similar technologies are used on this website for proper function of the website, for tracking performance analytics and for marketing purposes. We and some of our third-party providers may use cookie data for various purposes. Please review the cookie settings below and choose your preference.
Strictly Necessary: Used for the proper function of the website
Performance/Analytics: Used for monitoring website traffic and interactions
More and more often, businesses are using data to drive their decisions — which makes cutting-edge analytics and businessintelligence strategies one of the best advantages a company can have. Here are the six trends you should be aware of that will reshape businessintelligence in 2020 and throughout the new decade.
Guest author, Tableau DataDev Ambassador. Tableau is an innovator in the field of data visualization with its ease of use, stunning visualizations, vibrant community, and more contributing to success. Tableau recognizes that the way we use data today and the field of analytics is much different now than even a decade ago.
Guest author, Tableau DataDev Ambassador. Tableau is an innovator in the field of data visualization with its ease of use, stunning visualizations, vibrant community, and more contributing to success. Tableau recognizes that the way we use data today and the field of analytics is much different now than even a decade ago.
Open source businessintelligence software is a game-changer in the world of data analysis and decision-making. It has revolutionized the way businesses approach data analytics by providing cost-effective and customizable solutions that are tailored to specific business needs. What is open source businessintelligence?
It uncovers correlations and root causes, helping businesses understand why certain outcomes happened. Predictive analytics Predictive analytics utilizes statistical algorithms to forecast future outcomes. Tableau: Widely used for creating interactive dashboards and reports.
Summary: BusinessIntelligence tools are software applications that help organizations collect, process, analyse, and visualize data from various sources. These tools transform raw data into actionable insights, enabling businesses to make informed decisions, improve operational efficiency, and adapt to market trends effectively.
We’re looking at advanced artificial intelligence (AI) models, predictive analytics, and machine learning algorithms that can dive even deeper into data, delivering unprecedented insights. Tableau : It’s a visual analytics platform that transforms raw data into interactive, real-time dashboards.
Summary: Understanding BusinessIntelligence Architecture is essential for organizations seeking to harness data effectively. By implementing a robust BI architecture, businesses can make informed decisions, optimize operations, and gain a competitive edge in their industries. What is BusinessIntelligence Architecture?
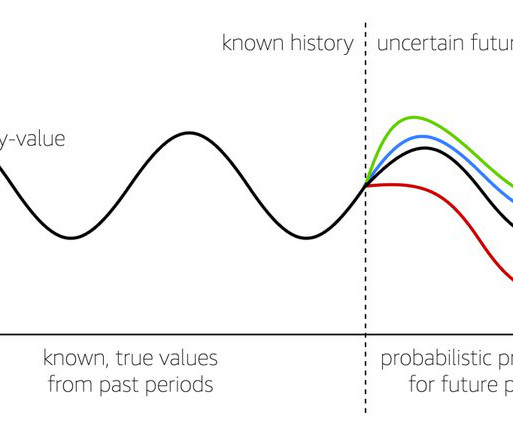
For time-series forecasting use cases, SageMaker Canvas uses autoML to train six algorithms on your historical time-series dataset and combines them using a stacking ensemble method to create an optimal forecasting model. To learn more about the modalities that Amazon SageMaker Canvas supports, visit the Amazon SageMaker Canvas product page.
By visualising likes, shares, and comments over time, they can adjust their algorithms to enhance user experience and increase engagement. TableauTableau is a leading data visualization tool known for its powerful capabilities and user-friendly interface.
There are many well-known libraries and platforms for data analysis such as Pandas and Tableau, in addition to analytical databases like ClickHouse, MariaDB, Apache Druid, Apache Pinot, Google BigQuery, Amazon RedShift, etc. The no-code visualization builds are a handy feature. This tool automatically detects problems in an ML dataset.
So, what are the best analytics tools for businesses in 2021? Things are always changing in the digital landscape, but here are some great options companies can use to create more informed business strategies. One of the biggest benefits of Tableau is that the software is free and extremely versatile. RapidMiner.
These tools leverage advanced algorithms and methodologies to process large datasets, uncovering valuable insights that can drive strategic decision-making. uses Hadoop to process over 24 petabytes of data daily, enabling them to improve their search algorithms and ad targeting. Use Cases : Yahoo!
Concepts such as linear algebra, calculus, probability, and statistical theory are the backbone of many data science algorithms and techniques. Coding skills are essential for tasks such as data cleaning, analysis, visualization, and implementing machine learning algorithms. This is where data visualization comes in.
The application of Artificial intelligence and BusinessIntelligence in affiliate marketing has been actively discussed for quite a time. In AI it refers to computer intelligence, while in BI it is about smart decision-making in business influenced by data analysis and visualization. BusinessIntelligence.
Data Analysis and Modeling This stage is focused on discovering patterns, trends, and insights through statistical methods, machine-learning models, and algorithms. Visualization libraries available in Python such as Matplotlib and Seaborn, and tools like Tableau and Power BI become crucial to telling stories that lead to insights.
This includes the application of sophisticated algorithms and statistical analyses aimed at gleaning insights that are actionable and predictive in nature. Advanced analytics equips organizations with tools to tackle intricate business challenges that standard businessintelligence (BI) tools may not effectively address.
Business users will also perform data analytics within businessintelligence (BI) platforms for insight into current market conditions or probable decision-making outcomes. By analyzing datasets, data scientists can better understand their potential use in an algorithm or machine learning model.
What is BusinessIntelligence? BusinessIntelligence (BI) refers to the technology, techniques, and practises that are used to gather, evaluate, and present information about an organisation in order to assist decision-making and generate effective administrative action. billion in 2015 and reached around $26.50
It’s a powerful framework that you can apply whether you’re creating machine learning algorithms to work with data or want to use analytics to solve business problems. In addition to supporting standard SQL, Apache Drill lets you keep depending on businessintelligence tools you may already use, such as Qlik and Tableau.
Understanding AI and Machine Learning Artificial Intelligence (AI) is the simulation of human intelligence in machines designed to think and act like humans. AI encompasses various technologies and applications, from simple algorithms to complex neural networks. Focus on Data Science tools and businessintelligence.
Further, Data Scientists are also responsible for using machine learning algorithms to identify patterns and trends, make predictions, and solve business problems. Significantly, in contrast, Data Analysts utilise their proficiency in a relational databases, BusinessIntelligence programs and statistical software.
Real-time analytics are becoming increasingly important for businesses that need to respond quickly to market changes. For example, financial institutions utilise high-frequency trading algorithms that analyse market data in milliseconds to make investment decisions.
Real-time analytics are becoming increasingly important for businesses that need to respond quickly to market changes. For example, financial institutions utilise high-frequency trading algorithms that analyse market data in milliseconds to make investment decisions.
Expertise in programs like Microsoft Excel, SQL , and businessintelligence (BI) tools like Power BI or Tableau allows analysts to process and visualise data efficiently. Certifications like Certified Business Analysis Professional (CBAP), Six Sigma, or Tableau Desktop Specialist can provide a competitive edge.
The demand for information repositories enabling businessintelligence and analytics is growing exponentially, giving birth to cloud solutions. Implementation of BusinessIntelligence All businessintelligence operations heavily rely on quality data, making data warehousing a crucial part of the process.
Modeling & Algorithms: Applying statistical models (like regression, classification, clustering) or Machine Learning algorithms to identify deeper patterns, make predictions, or classify data points. to understand the data’s main characteristics, distributions, and relationships. This helps formulate hypotheses.
For example, a data scientist might develop a machine-learning algorithm to predict customer churn, while a data analyst would analyze customer data to understand why churn occurred in the past. Banks employ sophisticated algorithms to analyze transaction patterns and identify suspicious activities in real-time.
And our mature relationships with partners like Snowflake, AWS, Databricks, and our connectors to Tableau and Power BI make us the natural choice for enterprises with complex data environments. In particular they are tied very well to Snowflake and Tableau which are our two most critical systems. “In
Price Optimization Software Tools like PROS or Vendavo use advanced algorithms to analyse historical sales data and predict optimal prices based on various factors such as demand elasticity and competitor actions. Below are some of the most effective tools and techniques used in Pricing Analytics.
So, what is Data Intelligence with an example? For example, an e-commerce company uses Data Intelligence to analyze customer behavior on their website. Through advanced analytics and Machine Learning algorithms, they identify patterns such as popular products, peak shopping times, and customer preferences.
Understanding Data Science Data Science is a multidisciplinary field that uses scientific methods, algorithms, and systems to extract knowledge and insights from structured and unstructured data. Finance In finance, Data Science is critical in fraud detection, risk management, and algorithmic trading.
Machine Learning Understanding Machine Learning algorithms is essential for predictive analytics. Tableau or Matplotlib) is critical for presenting insights to stakeholders who may not have a technical background. This includes supervised learning techniques like linear regression and unsupervised learning methods like clustering.
Hence a curriculum that focuses on nurturing industry-relevant skills like Machine Learning algorithms, data visualization, building dashboards, data interpretation and presentation will help you land a better-paying job. Today the application of Data Science is not limited to just one industry. It finds multidisciplinary applications.
And our mature relationships with partners like Snowflake, AWS, Databricks, and our connectors to Tableau and Power BI make us the natural choice for enterprises with complex data environments. In particular they are tied very well to Snowflake and Tableau which are our two most critical systems. “In
Then, I would explore forecasting models such as ARIMA, exponential smoothing, or machine learning algorithms like random forests or gradient boosting to predict future sales. Advanced Technical Questions Machine Learning Algorithms What is logistic regression, and when is it used? Explain the Extract, Transform, Load (ETL) process.
There are three main types, each serving a distinct purpose: Descriptive Analytics (BusinessIntelligence): This focuses on understanding what happened. Predictive Analytics: Forecasting future outcomes based on historical data and statistical algorithms. ” or “What are our customer demographics?
Data Structures and Algorithms (DSA): Why: Fundamental for clearing coding interviews across software development roles. Data Analysis and Transition to Machine Learning: Skills: Python, SQL, Excel, Tableau and Power BI are relevant skills for entry-level data analysis roles. Most Sought-After Skills 1.
We organize all of the trending information in your field so you don't have to. Join 17,000+ users and stay up to date on the latest articles your peers are reading.
You know about us, now we want to get to know you!
Let's personalize your content
Let's get even more personalized
We recognize your account from another site in our network, please click 'Send Email' below to continue with verifying your account and setting a password.


Let's personalize your content