This site uses cookies to improve your experience. To help us insure we adhere to various privacy regulations, please select your country/region of residence. If you do not select a country, we will assume you are from the United States. Select your Cookie Settings or view our Privacy Policy and Terms of Use.
Cookie Settings
Cookies and similar technologies are used on this website for proper function of the website, for tracking performance analytics and for marketing purposes. We and some of our third-party providers may use cookie data for various purposes. Please review the cookie settings below and choose your preference.
Used for the proper function of the website
Used for monitoring website traffic and interactions
Cookie Settings
Cookies and similar technologies are used on this website for proper function of the website, for tracking performance analytics and for marketing purposes. We and some of our third-party providers may use cookie data for various purposes. Please review the cookie settings below and choose your preference.
Strictly Necessary: Used for the proper function of the website
Performance/Analytics: Used for monitoring website traffic and interactions
This article was published as a part of the Data Science Blogathon. Introduction You might be wandering in the vast domain of AI, and may have come across the word ExploratoryDataAnalysis, or EDA for short. The post A Guide to ExploratoryDataAnalysis Explained to a 13-year-old!
What if you could skip the boring bits of dataanalysis and jump straight to the good stuff – like uncovering insights? appeared first on Analytics Vidhya.
Author(s): Sanjay Nandakumar Originally published on Towards AI. Methodology Overview In our work, we follow these steps: Data Generation: Generate a synthetic dataset that contains effects on the behaviour of voters. Important Steps of EDA: Distribution analysis: Plot the distribution of continuous variables such as age and income.
Author(s): Drewgelbard Originally published on Towards AI. Performing exploratorydataanalysis to gain insights into the dataset’s structure. By examining the data’s structure, distribution, and key characteristics, we can make informed decisions about preprocessing and model setup.
This means that you can use natural language prompts to perform advanced dataanalysis tasks, generate visualizations, and train machine learning models without the need for complex coding knowledge. This journey marks the rise of an AI powerhouse, promising continued innovation and utility in the realm of AI-powered assistance
Last Updated on January 27, 2023 by Editorial Team Last Updated on January 27, 2023 by Editorial Team Author(s): Puneet Jindal Originally published on Towards AI. Photo by Luke Chesser on Unsplash EDA is a powerful method to get insights from the data that can solve many unsolvable problems in business.
As artificial intelligence (AI) continues to transform industries—from healthcare and finance to entertainment and education—the demand for professionals who understand its inner workings is skyrocketing. Yet, navigating the world of AI can feel overwhelming, with its complex algorithms, vast datasets, and ever-evolving tools.
Summary: ExploratoryDataAnalysis (EDA) uses visualizations to uncover patterns and trends in your data. Histograms, scatter plots, and charts reveal relationships and outliers, helping you understand your data and make informed decisions. Imagine a vast, uncharted territory – your data set.
Author(s): Juliusnyambok Originally published on Towards AI. This article seeks to also explain fundamental topics in data science such as EDA automation, pipelines, ROC-AUC curve (how results will be evaluated), and Principal Component Analysis in a simple way. ExploratoryDataAnalysis is a pre-study.
Discover the power of Python libraries for (partial) automation of ExploratoryDataAnalysis (EDA). These tools empower both seasoned Data Scientists and beginners to explore datasets efficiently, extracting meaningful insights without the usual time constraints. What are auto EDA libraires?
From data management to model fine-tuning, LLMOps ensures efficiency, scalability, and risk mitigation. As LLMs redefine AI capabilities, mastering LLMOps becomes your compass in this dynamic landscape. Some projects may necessitate a comprehensive LLMOps approach, spanning tasks from data preparation to pipeline production.
There are also plenty of data visualization libraries available that can handle exploration like Plotly, matplotlib, D3, Apache ECharts, Bokeh, etc. In this article, we’re going to cover 11 data exploration tools that are specifically designed for exploration and analysis. Output is a fully self-contained HTML application.
Last Updated on April 7, 2024 by Editorial Team Author(s): Prashant Kalepu Originally published on Towards AI. This involves visualizing the data and analyzing key statistics. Photo by Lala Azizli on Unsplash Hey there, fellow learners! U+1F44B Welcome to another exciting journey in the realm of machine learning.
Introduction In 2025, the role of a data scientist remains one of the most sought-after and lucrative career paths in India’s rapidly growing technology and business sectors. Data quality issues are common in Indian datasets, so cleaning and preprocessing are critical. Master’s and Ph.D.:
Last Updated on August 17, 2023 by Editorial Team Author(s): Jeff Holmes MS MSCS Originally published on Towards AI. Jason Leung on Unsplash AI is still considered a relatively new field, so there are really no guides or standards such as SWEBOK. 85% or more of AI projects fail [1][2]. 85% or more of AI projects fail [1][2].
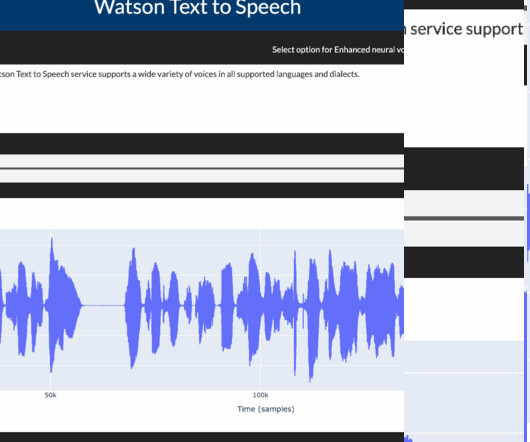
Data Processing and EDA (ExploratoryDataAnalysis) Speech synthesis services require that the data be in a JSON format. Embeddable AI You can start your AI journey by browsing & building AI models through a guided wizard here. For more information, Embeddable AI Webpage.
Last Updated on February 3, 2024 by Editorial Team Author(s): Kamireddy Mahendra Originally published on Towards AI. As a data scientist, we will explore the entire data set to understand each characteristic and identify any patterns existing if any in it. This process is called ExploratoryDataAnalysis(EDA).
Instead, organizations are increasingly looking to take advantage of transformative technologies like machine learning (ML) and artificial intelligence (AI) to deliver innovative products, improve outcomes, and gain operational efficiencies at scale. To facilitate this, an automated data engineering pipeline is built using AWS Step Functions.
Last Updated on February 22, 2023 by Editorial Team Author(s): Fares Sayah Originally published on Towards AI. Human resources face many challenges, and AI can help automate and solve some of these challenges. AI can help Human Resources with several tasks.
Loading the dataset allows you to begin exploring and manipulating the data. Step 3: ExploratoryDataAnalysis (EDA) ExploratoryDataAnalysis (EDA) is a critical step that involves examining the dataset to understand its structure, patterns, and anomalies.
Its flexibility allows you to produce high-quality graphs and charts, making it perfect for exploratoryDataAnalysis. Use cases for Matplotlib include creating line plots, histograms, scatter plots, and bar charts to represent data insights visually.
ExploratoryDataAnalysis(EDA)on Biological Data: A Hands-On Guide Unraveling the Structural Data of Proteins, Part II — ExploratoryDataAnalysis Photo from Pexels In a previous post, I covered the background of this protein structure resolution data set, including an explanation of key data terminology and details on how to acquire the data.
Perform ExploratoryDataAnalysis (EDA) Exploratorydataanalysis (EDA) is a critical step in any data science project. By avoiding common Data Analyst mistakes and adopting best practices, data analysts can improve the accuracy and usefulness of their insights.
Overview of Typical Tasks and Responsibilities in Data Science As a Data Scientist, your daily tasks and responsibilities will encompass many activities. You will collect and clean data from multiple sources, ensuring it is suitable for analysis.
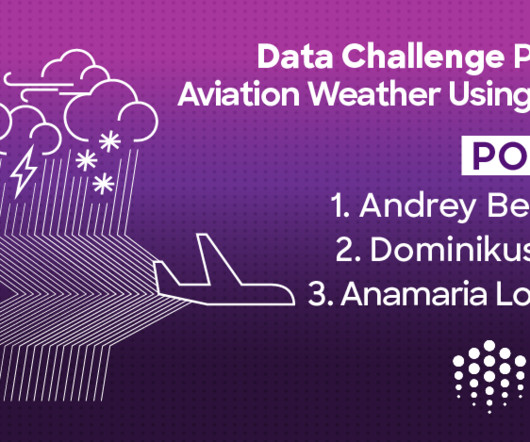
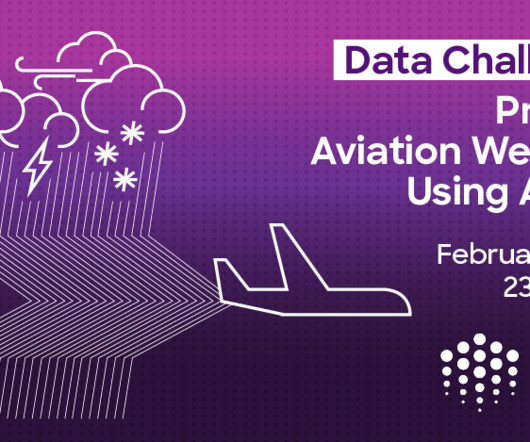
METAR, Miami International Airport (KMIA) on March 9, 2024, at 15:00 UTC In the recently concluded data challenge hosted on Desights.ai , participants used exploratorydataanalysis (EDA) and advanced artificial intelligence (AI) techniques to enhance aviation weather forecasting accuracy.
1, Data is the new oil, but labeled data might be closer to it Even though we have been in the 3rd AI boom and machine learning is showing concrete effectiveness at a commercial level, after the first two AI booms we are facing a problem: lack of labeled data or data themselves. “Shut up and annotate!”
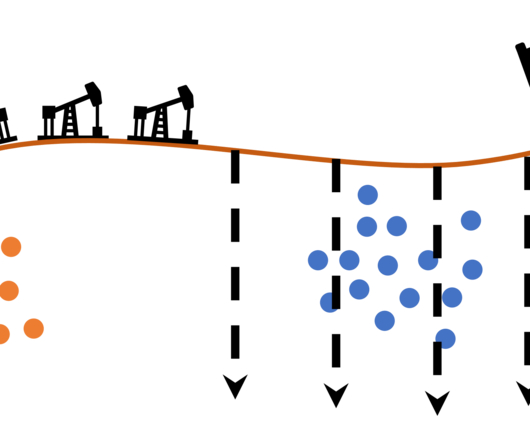
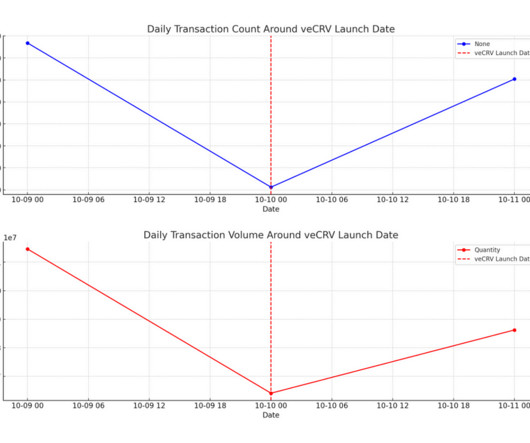
Abstract This research report encapsulates the findings from the Curve Finance Data Challenge , a competition that engaged 34 participants in a comprehensive analysis of the decentralized finance protocol. Part 1: ExploratoryDataAnalysis (EDA) MEV Over 25,000 MEV-related transactions have been executed through Curve.
” The answer: they craft predictive models that illuminate the future ( Image credit ) Data collection and cleaning : Data scientists kick off their journey by embarking on a digital excavation, unearthing raw data from the digital landscape. Machine learning and AI : Are you ready to casting predictive spells?
Integration also helps avoid duplication and redundancy of data, providing a comprehensive view of the information. Exploratorydataanalysis (EDA) Before preprocessing data, conducting exploratorydataanalysis is crucial to understand the dataset’s characteristics, identify patterns, detect outliers, and validate missing values.
Summary: Vertex AI is a comprehensive platform that simplifies the entire Machine Learning lifecycle. From data preparation and model training to deployment and management, Vertex AI provides the tools and infrastructure needed to build intelligent applications. Data Preparation Begin by ingesting and analysing your dataset.
This crucial step involves handling missing values, correcting errors (addressing Veracity issues from Big Data), transforming data into a usable format, and structuring it for analysis. This often takes up a significant chunk of a data scientist’s time. Think graphs, charts, and summary statistics.
Summary: AI in Time Series Forecasting revolutionizes predictive analytics by leveraging advanced algorithms to identify patterns and trends in temporal data. By automating complex forecasting processes, AI significantly improves accuracy and efficiency in various applications. billion by 2030. What is Time Series Forecasting?
Check out more of the talks and workshops from industry-leading data science and AI organizations coming to ODSC East 2023 below. Through real-world use cases, you’ll explore the ways Knowledge Graphs can enable a more intelligent, knowledge-aware conversational AI. It’s time for part 2 of our partner session highlight.
This data challenge took NFL player performance data and fantasy points from the last 6 seasons to calculate forecasted points to be scored in the 2024 NFL season that began Sept. AI / ML offers tools to give a competitive edge in predictive analytics, business intelligence, and performance metrics.
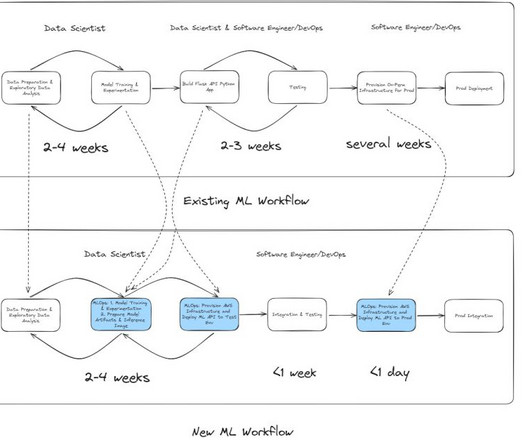
Legacy workflow: On-premises ML development and deployment When the data science team needed to build a new fraud detection model, the development process typically took 24 weeks.
ExploratoryDataAnalysis (EDA) ExploratoryDataAnalysis (EDA) is an approach to analyse datasets to uncover patterns, anomalies, or relationships. The primary purpose of EDA is to explore the data without any preconceived notions or hypotheses.
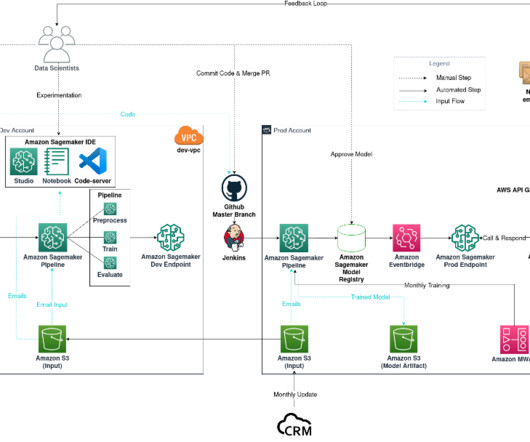
Email classification project diagram The workflow consists of the following components: Model experimentation – Data scientists use Amazon SageMaker Studio to carry out the first steps in the data science lifecycle: exploratorydataanalysis (EDA), data cleaning and preparation, and building prototype models.
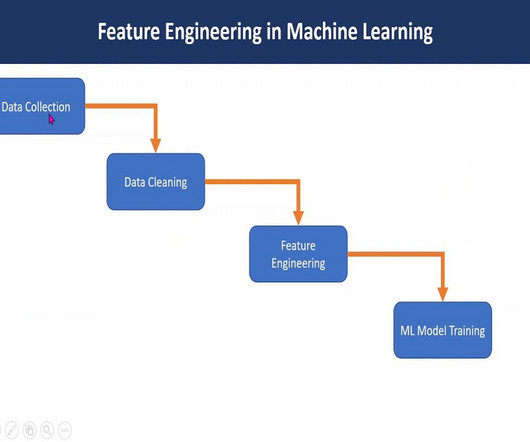
Feature engineering in machine learning is a pivotal process that transforms raw data into a format comprehensible to algorithms. Through ExploratoryDataAnalysis , imputation, and outlier handling, robust models are crafted. Steps of Feature Engineering 1.
F1 :: 2024 Strategy Analysis Poster ‘The Formula 1 Racing Challenge’ challenges participants to analyze race strategies during the 2024 season. They will work with lap-by-lap data to assess how pit stop timing, tire selection, and stint management influence race performance. Follow Ocean on Twitter or Telegram to keep up to date.
Example Use Cases Altair is commonly used in ExploratoryDataAnalysis (EDA) to quickly visualise data distributions, relationships, and trends. Example Use Cases ggplot in Python is ideal for exploratoryDataAnalysis, particularly when users want to quickly understand patterns and relationships between variables.
Blind 75 LeetCode Questions - LeetCode Discuss Data Manipulation and Analysis Proficiency in working with data is crucial. This includes skills in data cleaning, preprocessing, transformation, and exploratorydataanalysis (EDA).
Challenge Overview Objective : Building upon the insights gained from ExploratoryDataAnalysis (EDA), participants in this data science competition will venture into hands-on, real-world artificial intelligence (AI) & machine learning (ML). Follow Ocean on Twitter or Telegram to keep up to date.
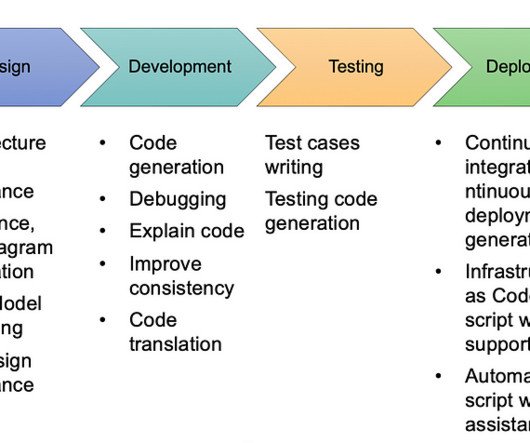
Increase your productivity in software development with Generative AI As I mentioned in Generative AI use case article, we are seeing AI-assisted developers. Overall Generative AI in SDLC Here is how Generative AI can help in SDLC stages (we may see more use cases as Generative AI matures).
We take a gap year to participate in AI competitions and projects, and organize and attend events. We look for AI competitions that contribute to the UN SDGs, and have a timeframe of 2~3 months. Combining deep and practical understanding of technology, computer vision and AI with experience in big data architectures.
We organize all of the trending information in your field so you don't have to. Join 17,000+ users and stay up to date on the latest articles your peers are reading.
You know about us, now we want to get to know you!
Let's personalize your content
Let's get even more personalized
We recognize your account from another site in our network, please click 'Send Email' below to continue with verifying your account and setting a password.


Let's personalize your content