This site uses cookies to improve your experience. To help us insure we adhere to various privacy regulations, please select your country/region of residence. If you do not select a country, we will assume you are from the United States. Select your Cookie Settings or view our Privacy Policy and Terms of Use.
Cookie Settings
Cookies and similar technologies are used on this website for proper function of the website, for tracking performance analytics and for marketing purposes. We and some of our third-party providers may use cookie data for various purposes. Please review the cookie settings below and choose your preference.
Used for the proper function of the website
Used for monitoring website traffic and interactions
Cookie Settings
Cookies and similar technologies are used on this website for proper function of the website, for tracking performance analytics and for marketing purposes. We and some of our third-party providers may use cookie data for various purposes. Please review the cookie settings below and choose your preference.
Strictly Necessary: Used for the proper function of the website
Performance/Analytics: Used for monitoring website traffic and interactions
Surging fraud volumes and sophisticated AI tools have changed the dynamics for anti-fraud teams. While it has always been a data-intensive process, enterprise fraud management today is more complex and more important than ever. An AI-powered fight back? Automation is nothing new in enterprise fraud management.
Artificial intelligence is changing the way organizations think about data analysis. AI and datavisualization can do a lot of the heavy lifting for analysts and investigators working with connected data – helping them detect, understand and even predict risks and threats.
We’ve recently explored the huge impact of AI in fraud detection – in this post, we’ll look at eight other trends driving demand for better datavisualization in the financial services sector. Download our whitepaper on network and timeline visualization for cloud security to find out more about this use case.
Rectangular combos offer a clear, space-efficient option for complex infrastructure networks Another key part of modern cloud security applications is their use of AI and machine learning to create timely and accurate alerts. A key part of the process is resolving multiple identifiers into single entities, often stored in different datasets.
Data literacy is a key component for any organization to be able to scale responsible and trusted artificial intelligence technology. Because of the multidisciplinary nature of AI products, stakeholders across an entire organization must share a common understanding of each project’s scope, deployment, governance , impact, and projected risk.
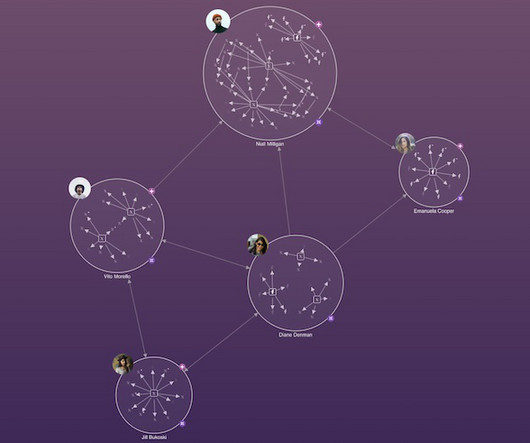
The challenge to understand hidden relationships and uncover actionable insights from data is universal, across countless datavisualization use cases. In this blog post, we focus on seven of the most popular: Why visualizedata as a graph? Datavisualization makes it easy for us to identify trends and outliers.
It looks at the role datavisualization plays to detect, investigate and prevent misinformation and disinformation, and keep digital spaces safe. They exploit new technologies to create AI-generated false information, and harness the power of global social media platforms to spread their messages far and wide.
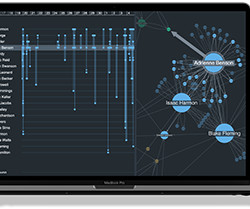
The data boom 2. AI-powered data analytics 5. Weaponized misinformation and disinformation Using link analysis powered by timeline visualization to track and investigate social media communications What is link analysis? We focus on: 1. Cutting through the cloud chaos 3. Collaborating with anyone, anywhere, anytime 4.
We organize all of the trending information in your field so you don't have to. Join 17,000+ users and stay up to date on the latest articles your peers are reading.
You know about us, now we want to get to know you!
Let's personalize your content
Let's get even more personalized
We recognize your account from another site in our network, please click 'Send Email' below to continue with verifying your account and setting a password.


Let's personalize your content